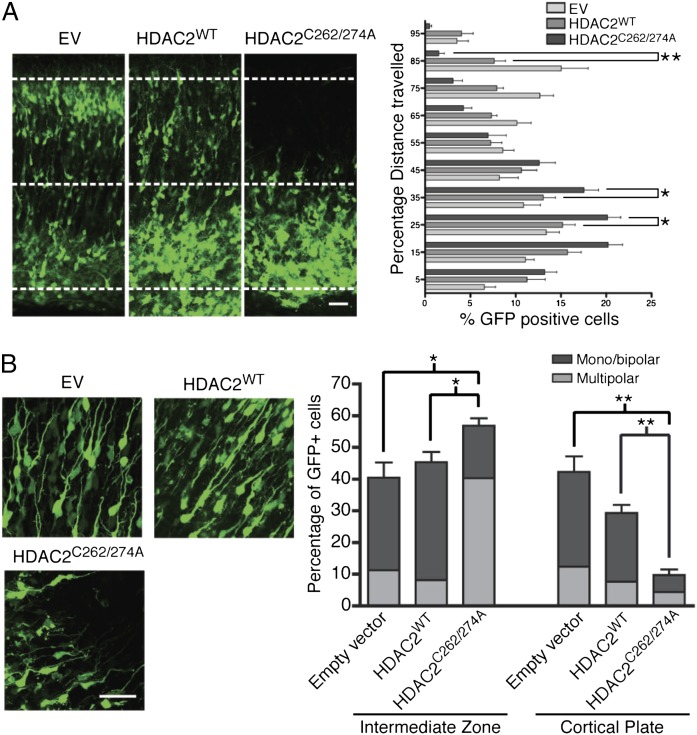
Fig. 2.
S-nitrosylation of HDAC2 regulates radial neuron migration. (A) Images of cortical slices obtained from E14.5 embryos ex vivo electroporated with HDAC2 siRNA and pCIG-IRES-eGFP, pCIG-HDAC2WT, or pCIG-HDAC2C262/274A and cultured for 5 d. Quantitative analysis of eGFP-positive cells as percentage distance from VZ. (Scale bar, 50 µm.) Shown are averages and SEM. *P < 0.05, two-way ANOVA, Bonferroni post hoc test; EV, n = 7; HDAC2WT and HDAC2C262/274A, n = 8. (B) (Left) E14.5 embryos were ex vivo electroporated, and organotypic slices were cultured for 5 d in vitro. The images show eGFP-expressing neurons within the IZ. (Right) Quantitative analysis was performed by calculating the percentage of GFP cells within either the IZ or the CP with monopolar/bipolar or multipolar morphology. (Scale bar, 50 µm.) Averages and SEM, n = 3. *P < 0.001 for empty vector and HDAC2WT versus HDAC2C262A/C274A multipolar cells and HDAC2WT versus HDAC2C262A/C274A monopolar/bipolar cells; *P < 0.005 for empty vector versus HDAC2C262A/C274A monopolar/bipolar cells in IZ; **P < 0.001 for empty vector and HDAC2WT versus HDAC2C262A/C274A monopolar/bipolar cells in CP; two-way ANOVA, Bonferroni post hoc test.

