Fig. 3.
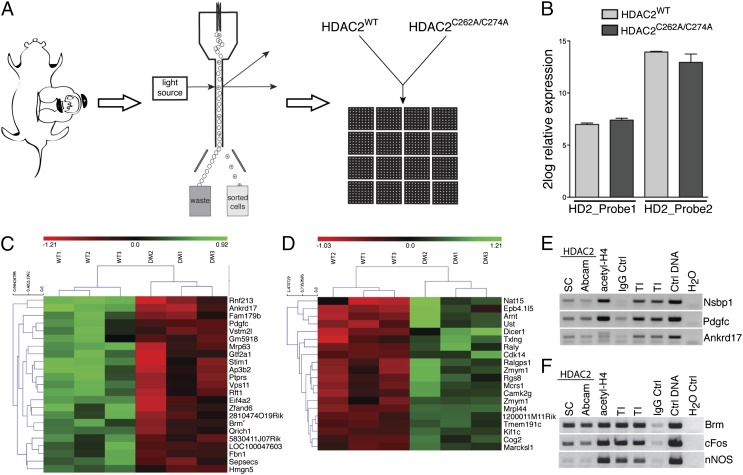
Characterization of the transcriptional program regulated by HDAC2 S-nitrosylation. (A) Embryos were in utero electroporated at E14.5, and after 18 h cortices were microdissected and dissociated. GFP-expressing cells were FAC-sorted, and RNA was extracted and hybridized to genome-wide bead arrays. (B) Relative expression of endogenous HDAC2 (HDAC2_Probe1) and overexpressed HDAC2WT or HDAC2C262A/C274A (HDAC2_Probe2). HDAC2 transcript levels were comparable between HDAC2C262A/C274A and HDAC2WT samples. The y axis represents 2log relative expression; n = 3. (C and D) Heat maps generated using the 43 transcripts potentially regulated by HDAC2 S-nitrosylation. Shown are 2log relative transcript levels in HDAC2WT and HDAC2C262/274A electroporation conditions. Samples were clustered based on euclidean distance (clustering of samples is indicated at the top; clustering of target genes is indicated at the left). Color scale bar represents 2log relative expression [2log(expression sample) – 2log(average expression all samples)]; green, up-regulation; red, down-regulation; black, no change; n = 3. (E and F) ChIP validation of target transcripts in E14.5 cortical tissue. Immunoprecipitation against HDAC2 (Santa Cruz and Abcam), acetylated histone H4, and rabbit IgG was followed by PCR for Nsbp1, Pdgfc, Ankrd17, Brm, nNOS, and cFos promoters. n = 3.

