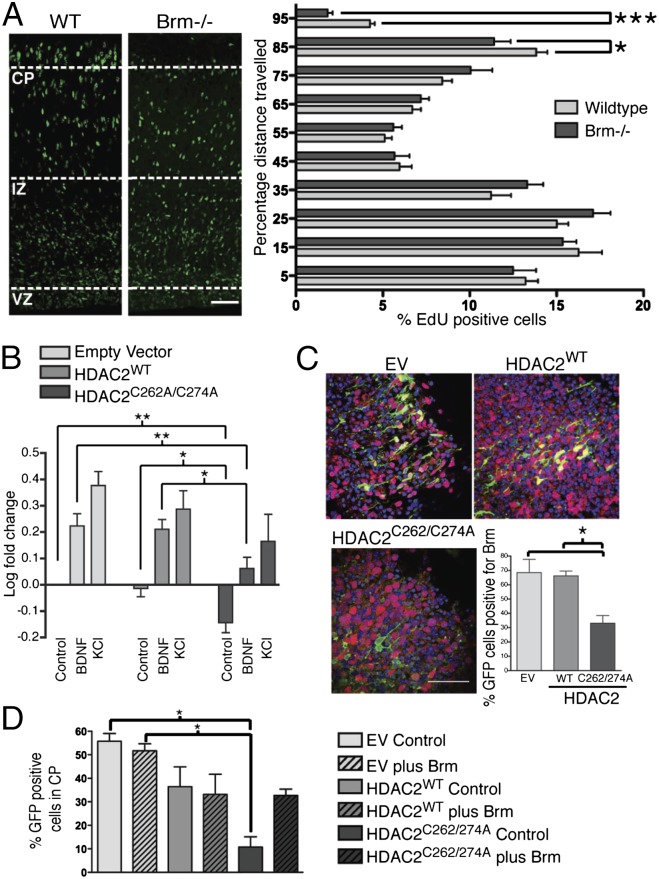
Fig. 5.
NO and S-nitrosylation of HDAC2 regulates Brm cortical expression. (A) Confocal images of WT and Brm−/− cortices from embryos of E15.5 mice injected with EdU, killed 72 h after injection. Quantitative analysis of distance traveled of EdU-positive neurons. Values are expressed as the percentage distance from VZ. Shown are averages and SEM; *P < 0.05, ***P < 0.0002, unpaired t test. (Scale bar, 50 µm.) WT embyos, n = 9; Brm−/− embryos, n = 9. (B) Luciferase assay of Brm promoter using cortical neurons transfected with HDAC2 siRNA and EV, pCIG-HDAC2WT, or pCIG-HDAC2C262/274A. Neurons were stimulated with either vehicle, BDNF (75 ng⋅ml−1) or KCl (50 mM), for 24 h. Averages and SEM; *P < 0.05, **P < 0.01; one-way ANOVA, Bonferroni post hoc test; n = 5. (C) Expression of Brm in cortices ex vivo electroporated with HDAC2 siRNA and EV, pCIG-HDAC2WT, or pCIG-HDAC2C262/274A. Images of the CP from slices cultured for 5 d and stained for DAPI (blue), GFP (green), and Brm (red). (Scale bar, 50 µm.) n = 5. Quantitative analysis of GFP-positive cells expressing Brm in the CP. Shown are averages and SEM; *P < 0.05; one-way ANOVA, Bonferroni post hoc test; n = 3. (D) Images of cortex from slices of E14.5 embryos ex vivo electroporated with siHDAC2 and pCIG-IRES-eGFP, pCIG-HDAC2WT, or pCIG-HDAC2C262/274A and cultured for 5 d. Brains were coelectroporated with either pDEST26-hBrm (24) (Brm) or EV. Quantitative analysis of eGFP-expressing neurons expressed as percentage distance from VZ. (Scale bar, 50 µm.) Shown are averages and SEM; *P < 0.05; one-way ANOVA, Bonferroni post hoc test; n = 3.

