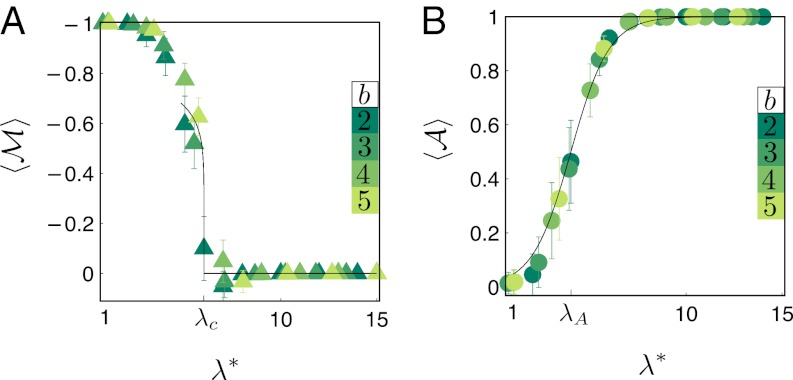
Fig. 2.
Second-order phase transition, the information hidden near phase transition, and the exponent β. (A) Plot of 〈ℳ〉 for b = 2–5 as a function of λ*, obtained from  . The SD is indicated by the error bars. The black curve is the best fit to the points near the phase transition (λc = 6), with the critical exponent β = 0.12. (B) Ensemble average 〈
 〉 for b = 2–5 with the same procedure as in A for representing λ in base 2 denoted by λ*. It is best fit by the sigmoid function centered at λA = 4.

