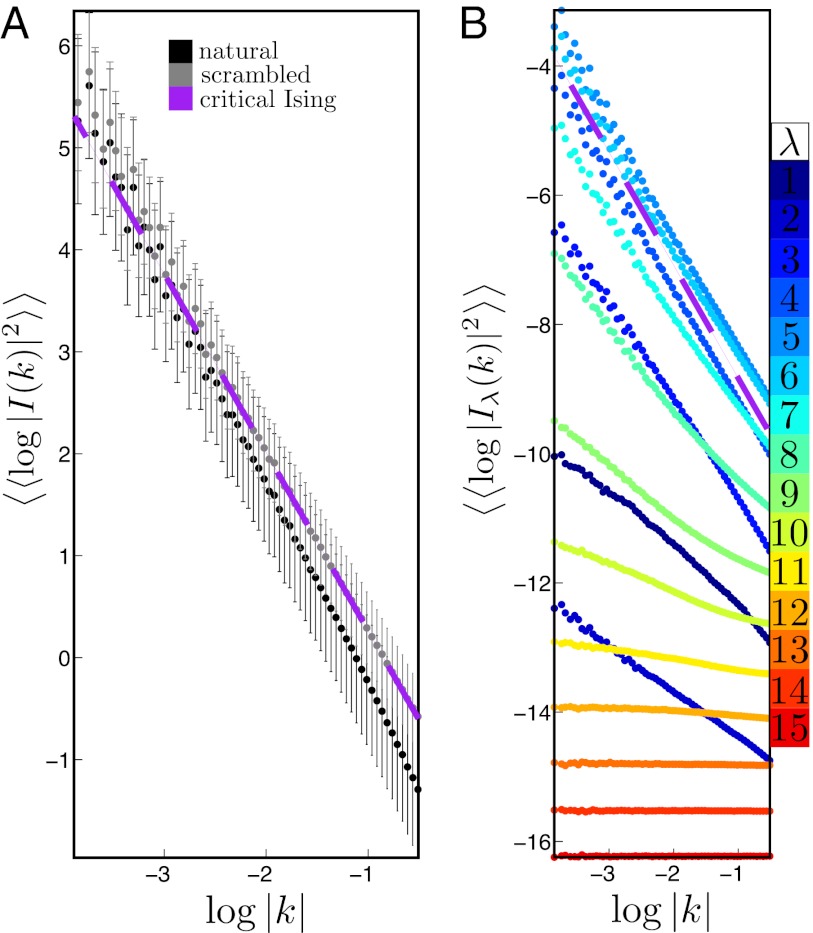
Fig. 3.
Power spectrum of binary layers, natural images, and scrambled natural images. (A) Power spectrum of natural images in black and scrambled natural images in gray. The purple dashed line is the result for the critical point of the 2D ferromagnetic Ising model. (B) Power spectrum of binary layers of natural images weighted by 215−λ (Iλ(k) is the Fourier transform of ℐλ = 215−λℬλ), from the top cold layer represented by dark blue to the hot bottom layer represented by red. The inner average is over different k orientations, and the outer average is over the ensemble of images.

