Fig. 1.
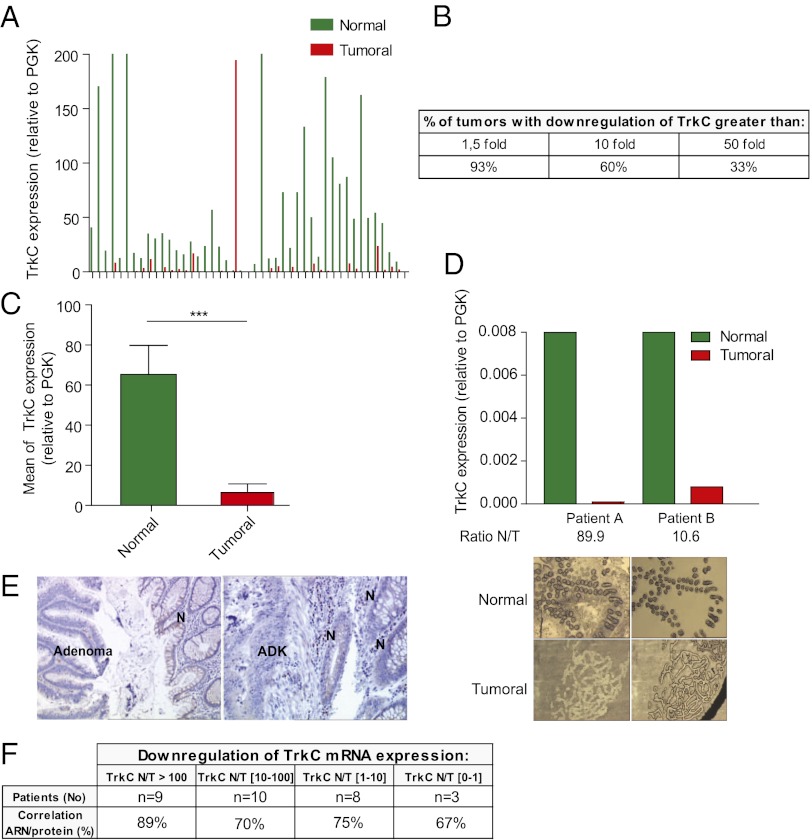
TrkC expression is lost in colorectal tumors. (A–C) Quantitative real-time RT-PCR was performed using total RNA extracted from normal (N) and tumoral (T) tissues with specific human TrkC primers. PGK showing the less variability in their expression between normal and colorectal tumoral tissues, as described previously (20), was used as housekeeping gene. (A) The expression levels in 45 colorectal tumors (Tumoral) and corresponding normal tissue (Normal) are given as a ratio between TrkC and PGK, the internal control. (B) Table indicating the percentage of patients showing a loss of TrkC expression in tumor compared with normal tissue. (C) Mean TrkC expression in tumoral tissues versus normal tissues is presented. ***P < 0.001, two-sided Mann–Whitney test, the two means being compared. (D) Laser capture microdissection (LCM) was performed on 8 pairs of tumor/normal tissues (two representative pairs being presented here), and TrkC expression was determined as in A. (Upper) The expression levels in 2 colorectal tumors (T) and corresponding normal tissue (N) are given as a ratio between TrkC and PGK. (Lower) Typical microscopic visualization of LCM on colon section from human normal (N) or tumoral biopsies (T). Sections are shown before LCM (Left) and after LCM (Right), as the captured material is confirmed under microscopic visualization before processing for RNA extraction. (E) Immunostaining of TrkC protein was performed on tissue sections isolated from biopsies of two different patients and counterstained with Mayer’s hematoxylin. N, normal tissue; ADK, adenocarcinoma. (F) Table showing the correlation between TrkC mRNA expression and TrkC protein expression determined by immunostaning in pair normal/tumor for 30 patients in the panel of 45 patients.

