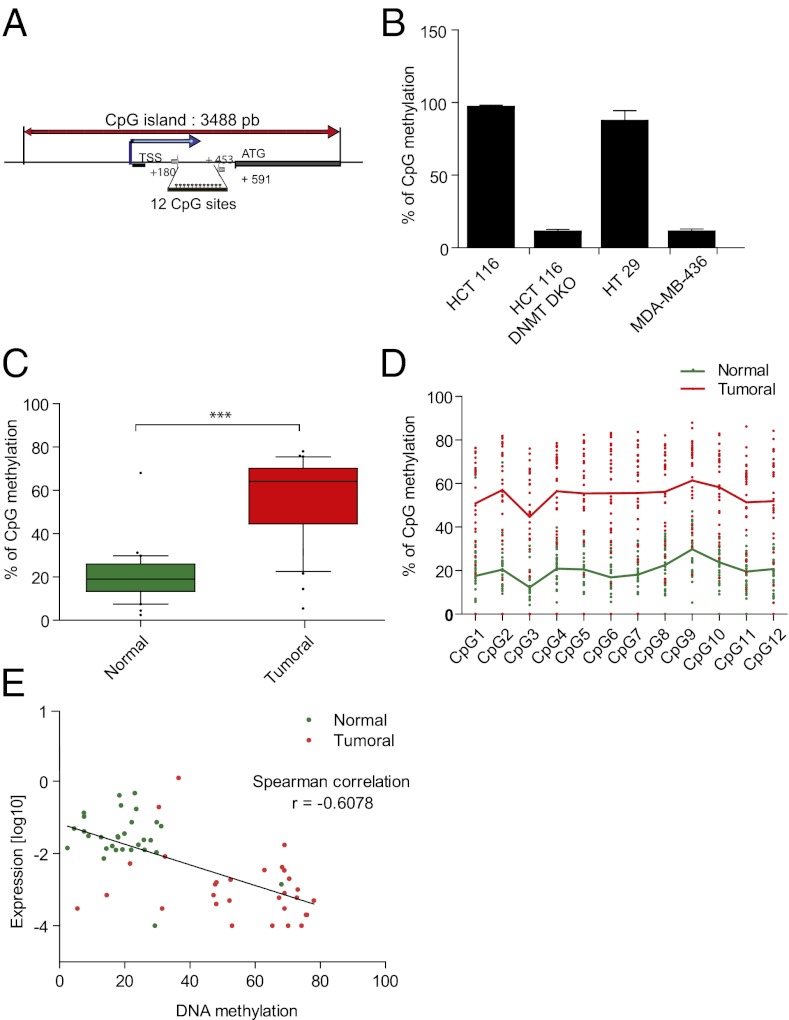
Fig. 3.
TrkC promoter is hyper-methylated in tumoral colorectal tissue. (A) A schematic representation of TrkC promoter is shown. The main CpG island, the transcription start site (TSS), and translation starting codon (ATG) are represented. The primers used for the pyrosequencing of the 12 CpG sites indicated were located in (+180;+205) and (+453;+476). (B) Analysis by pyrosequencing of the TrkC promoter methylation in TrkC-negative cells (HCT116 WT, HT29) and in TrkC-positive cells (HCT116 DNMT DKO colorectal cell lines and MDA-MB-436 breast cell line). (C) Analysis by pyrosequencing of the TrkC promoter methylation in matched normal and tumoral colorectal tissues from 30 patients in the panel of 45 patients. Statistical analysis has been performed using two-sided Mann–Witney test. ***P < 0.001. (D) Pyrosequencing of the TrkC promoter methylation in matched normal and tumoral colorectal tissues from a single patient. A representative diagram showing the methylation level on each of the 12 CpG sites analyzed is shown. (E) Inverse correlation between the decrease of TrkC mRNA level and DNA methylation of the TrkC promoter.

