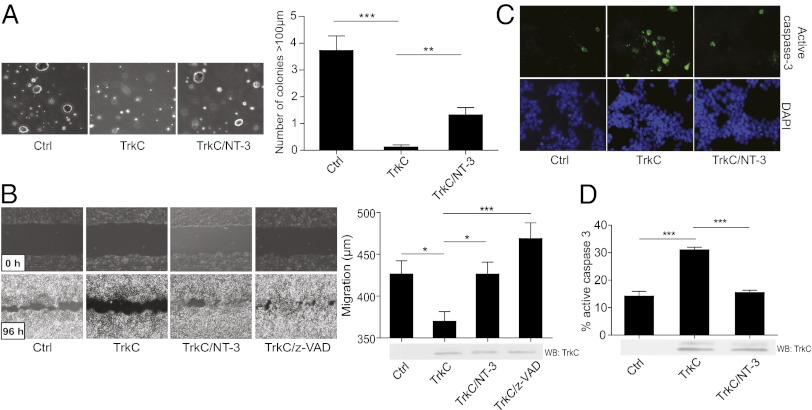
Fig. 4.
Re-expression of TrkC limits the hallmarks of colorectal cancer cells transformation via apoptosis induction. (A) Control, TrkC, or both TrkC and NT-3 overexpressing HCT116 cells were grown in soft agar for two weeks. The number of colonies was counted in five random fields and the average number per field was calculated. Data represent mean ± SEM *P < 0.05, ***P < 0.001, two-sided Mann–Whitney test, compared with control. Photographs of representative colonies for each condition are shown. (B) Scratch assay was performed on HCT116 cells expressing control vector and TrkC with or without NT-3 and z-VAD-fmk addition. The scratch open area was measured at 0 h and 96 h and the migration distance was determined. Representative photographs are shown. (C and D) Control, TrkC or both TrkC and NT-3 overexpressing HCT116 cells were immunolabeled for active caspase-3. Representative photographs are shown in C. The quantification and the corresponding Western blot controlling TrkC expression level are shown in D. ***P < 0.001, two-sided Mann–Whitney test.

