Fig. 2.
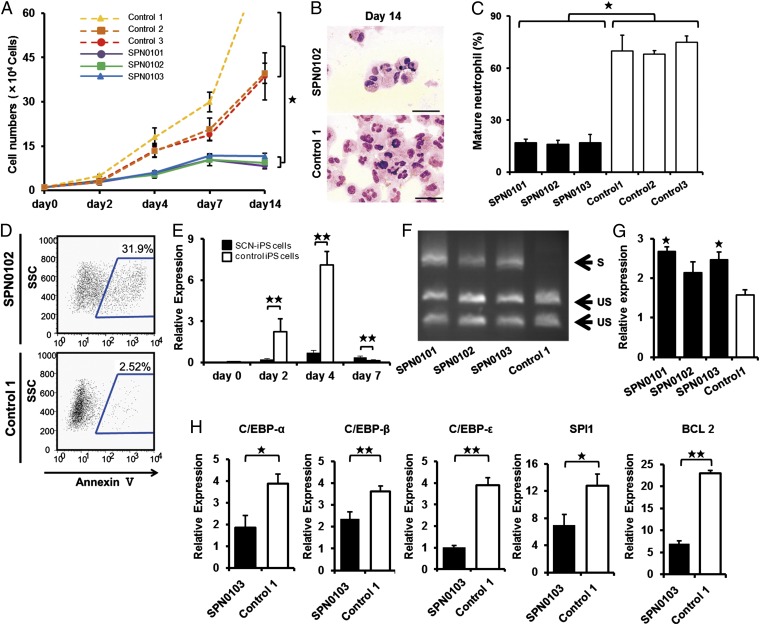
Analysis of impaired neutrophil development from SCN-iPS cells. (A) Total number of nonadherent cells in the suspension culture of 1 × 10⁴ CD34+ cells derived from SCN-iPS and control iPS cells. Data are shown as mean ± SD. ★P < 0.01. (B) Photographs of nonadherent cells derived from SCN-iPS (SPN0103) and control iPS cells (control 1) on day 14 of culture (400×; May–Grünwald–Giemsa staining; scale bars, 50 μm.) (C) Filled and open bars show the proportion of mature neutrophils among the cells derived from SCN-iPS (filled bars) and control iPS (open bars) cells on day 14 of suspension culture. Data are shown as mean ± SD. ★P < 0.05. (D) Flow cytometric analysis of annexin V expression on cultured cells from SCN-iPS cells (SPN0102) or control iPS cells (control 1) on day 7. (E) Sequential qRT-PCR analysis of the relative expression of ELANE mRNA [ELANE/hypoxanthine–guanine phosphoribosyltransferase (HPRT) expression]. Data obtained from independent experiments using three SCN-iPS cell clones (SPN0101, SPN0102, and SPN0103) and three control iPS cell clones are shown as mean ± SD. ★★P < 0.01. (F and G) CD34+ cells derived from SCN-iPS or control iPS cells were cultured in neutrophil differentiation medium (see text). On day 7, nonadherent cells were collected and analyzed. (F) Representative gel showing spliced (S) and unspliced (US) XBP-1 bands on day 7. (G) qRT-PCR analysis of the relative mRNA expression (target/HPRT expression) of BiP on day 7. Data are shown as mean ± SD. ★P < 0.05; different from control 1). (H) qRT-PCR analysis of the relative mRNA expression (target / HPRT expression) of C/EBP-α, C/EBP-β, C/EBP-ɛ, SPI1, and BCL2 genes in non-adherent cells derived from SCN-iPS cells (filled bars, SPN0103) and control iPS cells (open bars, control 1) on day 2 of suspension culture. Data are shown as the mean ± the s.d. (★★P < 0.01, ★P < 0.05).

