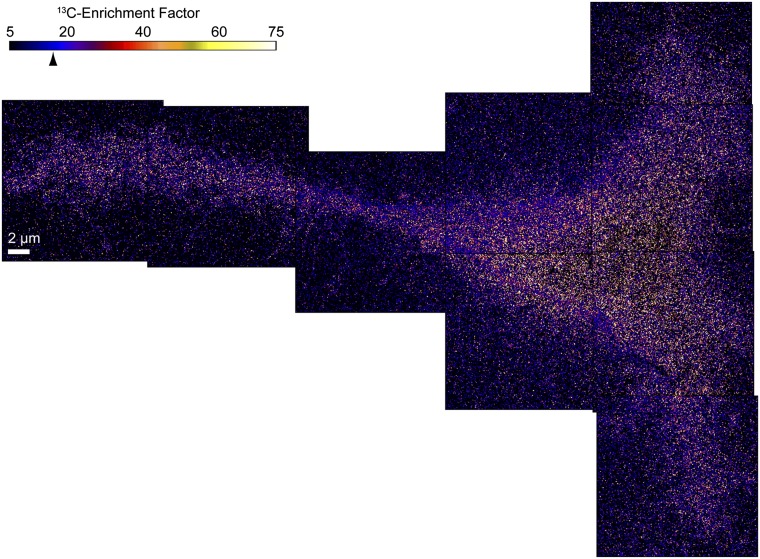
Fig. 3.
13C-enrichment images of a Clone 15 fibroblast cell were acquired in parallel with the secondary electron (Fig. 1) and 15N-enrichment (Fig. 2) images. Montage of quantitative 13C-enrichment images reveals the distribution of all lipids in the plasma membrane of the Clone 15 cell (cell 1). The color scale shows the measured 13C1H−/12C1H− ratio divided by the natural abundance ratio, corresponding to the 13C-lipid enrichment compared with an unlabeled cell (Fig. S2). The mean 13C-enrichment for the entire surface of the cell was 16.3 (arrowhead, SD = 22.5). The elevated 13C-enrichment and the absence of statistically significant lateral variations in the 13C-enrichment on the cell verify the plasma membrane was intact. Speckling is due to low counts of the CH isotopologues.

