
Fig. 7.
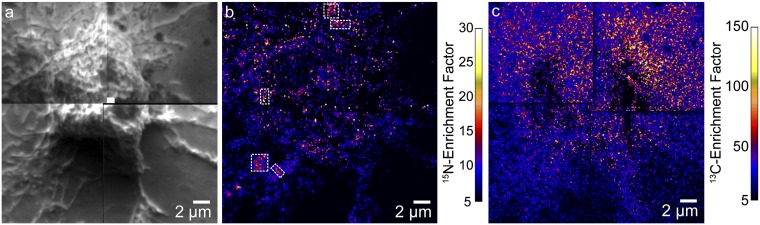
Secondary electron, 15N-enrichment, and 13C-enrichment images of a Clone 15 cell that was treated with lat-A for 30 min to disrupt the cytoskeleton. (A) Montage of secondary electron images acquired with NanoSIMS shows the extensive cell rounding that is characteristic of cytoskeleton disruption by lat-A treatment. (B) Montage of 15N-enrichment images of the same cell shows that micrometer-scale sphingolipid domains were not present on the cell surface after disruption of the cytoskeleton by treatment with lat-A. A few micrometer-scale 15N-sphingolipid aggregates are present on the cellular extensions adjacent to the rounded cell body (outlined with a dashed white line). (C) Montage of 13C-enrichment images shows the 13C-lipid distribution at the same location. The high 13C-enrichment on the substrate adjacent to the cell likely signifies the presence of membrane fragments.