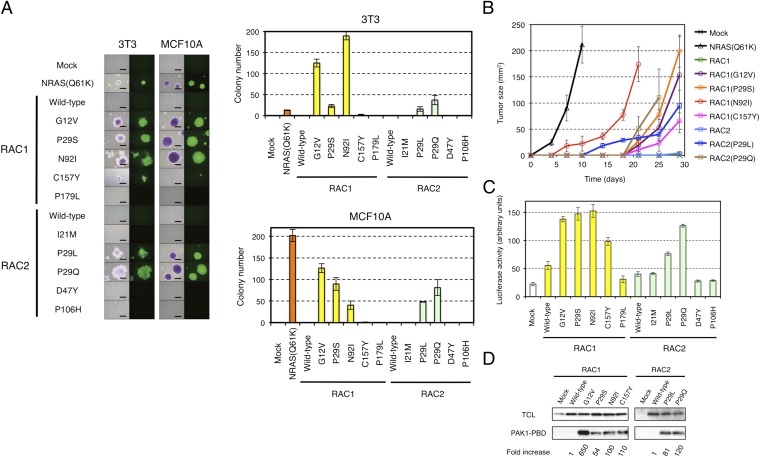
Fig. 1.
Transforming potential of RAC1 and RAC2 mutants. (A) 3T3 or MCF10A cells were infected with recombinant retroviruses encoding enhanced green fluorescent protein (EGFP) as well as wild-type or mutant forms of RAC1 or RAC2 and were then assayed for anchorage-independent growth in vitro under the presence of 10% (vol/vol) FBS. After 14 d (3T3) or 20 d (MCF10A) of culture, the cells were stained with crystal violet and examined by conventional microscopy (Left: left image of each pair), and they were monitored for EGFP expression by fluorescence microscopy (Left: right image of each pair). (Scale bars, 0.5 mm.) The numbers of cell colonies were also determined as means ± SD from three independent experiments (Right). (B) 3T3 cells expressing wild-type or mutant forms of RAC1 or RAC2 were injected s.c. into the shoulder of nude mice, and the size of the resulting tumors [(length × width)/2] was determined at the indicated times thereafter. Tumor size for 3T3 expressing NRAS(Q61K) was similarly monitored. Data are means ± SD for tumors at four injection sites. (C) HEK293T cells were transfected with expression vectors for wild-type or mutant forms of RAC1 or RAC2 together with the SRE.L reporter plasmid and pGL-TK. The activity of firefly luciferase in cell lysates was then measured and normalized by that of Renilla luciferase. Data are means ± SD from three independent experiments. (D) Lysates of 3T3 cells expressing wild-type or mutant forms of RAC1 or RAC2 were subjected to a pull-down assay with PAK1-PBD. The precipitated proteins as well as the total cell lysates were then subjected to immunoblot analysis with antibodies to RAC1 or to RAC2. The relative amounts of pulled-down RAC proteins compared with their corresponding expression levels in total cell lysate were normalized to that of wild-type RAC1 (for the RAC1 mutants) or RAC2 (for the RAC2 mutants) and are shown at the bottom.

