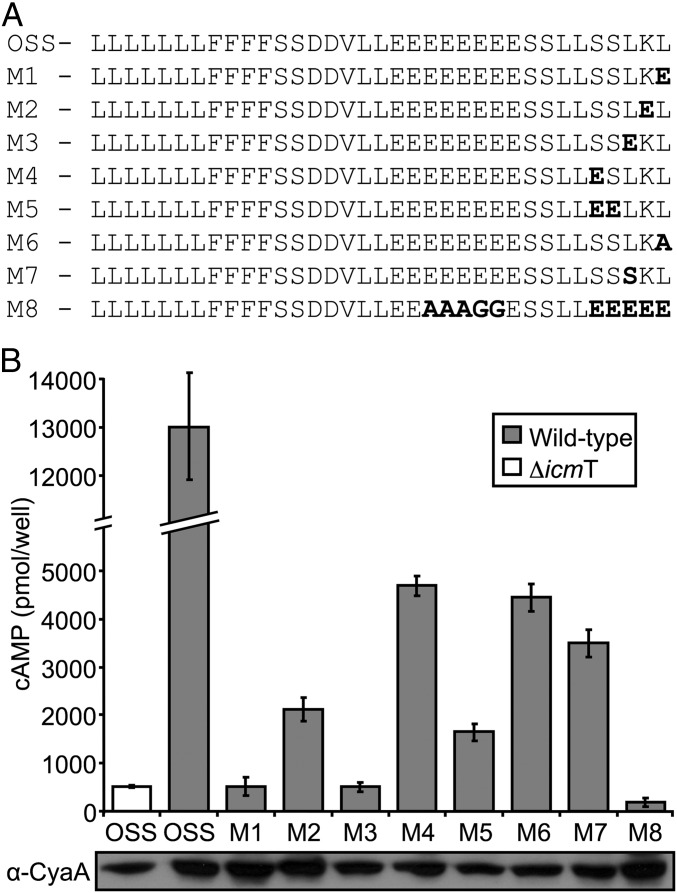
Fig. 3.
Mutation analysis of the OSS. (A) Amino acid sequences of the OSS and the mutations constructed are shown. The mutated residues are marked in bold. (B) CyaA fusions of the OSS and the eight mutated OSSs were examined for translocation from the WT strain JR32 into HL-60–derived human macrophages. The translocation level of the OSS from the icmT deletion mutant is also presented. The bar heights represent the means of cAMP levels per well obtained from at least three independent experiments; error bars represent SDs. The cAMP levels were found to be significantly different (P < 10−6, paired Student t test) when comparing the OSS and each of the mutants. Protein levels were assessed by Western blot using α-CyaA antibody and are shown below each bar.

