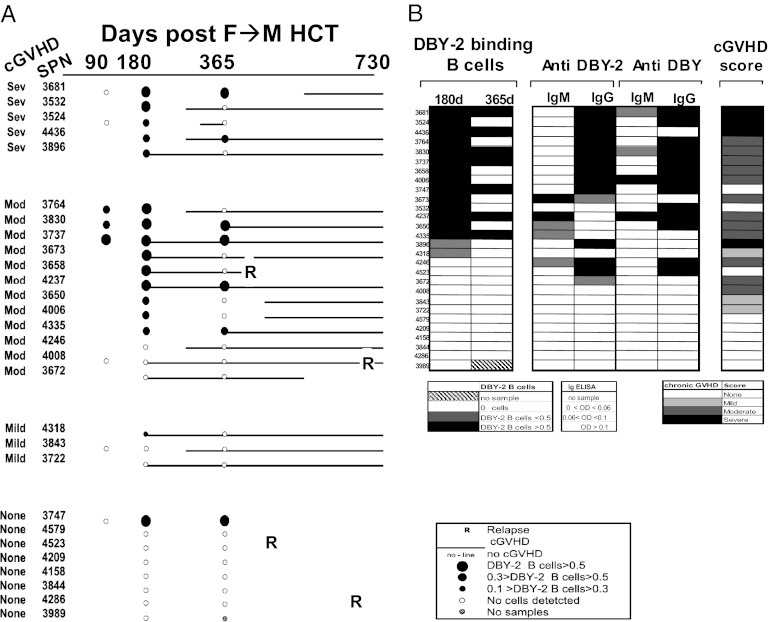
Fig. 2.
Anti–DBY-2 B-cell development, anti–DBY-2 Ig, and severity of cGVHD in 28 F→M HCT patients. (A) The temporal development of anti–DBY-2 B cells and cGVHD is schematically depicted for 28 F→M patients with clinical follow-up through 730 d on the x-axis. Filled circles indicate presence of DBY-2–specific B cells; the size of the circle reflects the percentage of these B cells among PBMC lymphocytes. Open circles indicate that anti–DBY-2 B-cell frequencies were below detectability (<0.1%) of PBMC lymphocytes. Solid line indicates cGVHD onset and duration. R marks time of hematologic malignancy relapse. (B) The frequency of DBY-2 B cells detected at 180 and 365 d are related to Ig development against DBY-2 peptide epitope, full-length DBY protein, and cGVHD development. cGVHD patients were ranked by frequency of DBY-2 B cells detected 180 d after transplant and secondarily by presence of IgG anti–DBY-2 in serum. Other columns include the unique Stanford Patient Number (SPN), each patient’s National Institutes of Health cGVHD score, the maximum IgM and IgG anti-DBY or anti–DBY-2 levels measured by ELISA within 1 y after HCT. The legends indicate the relative intensity of each value.

