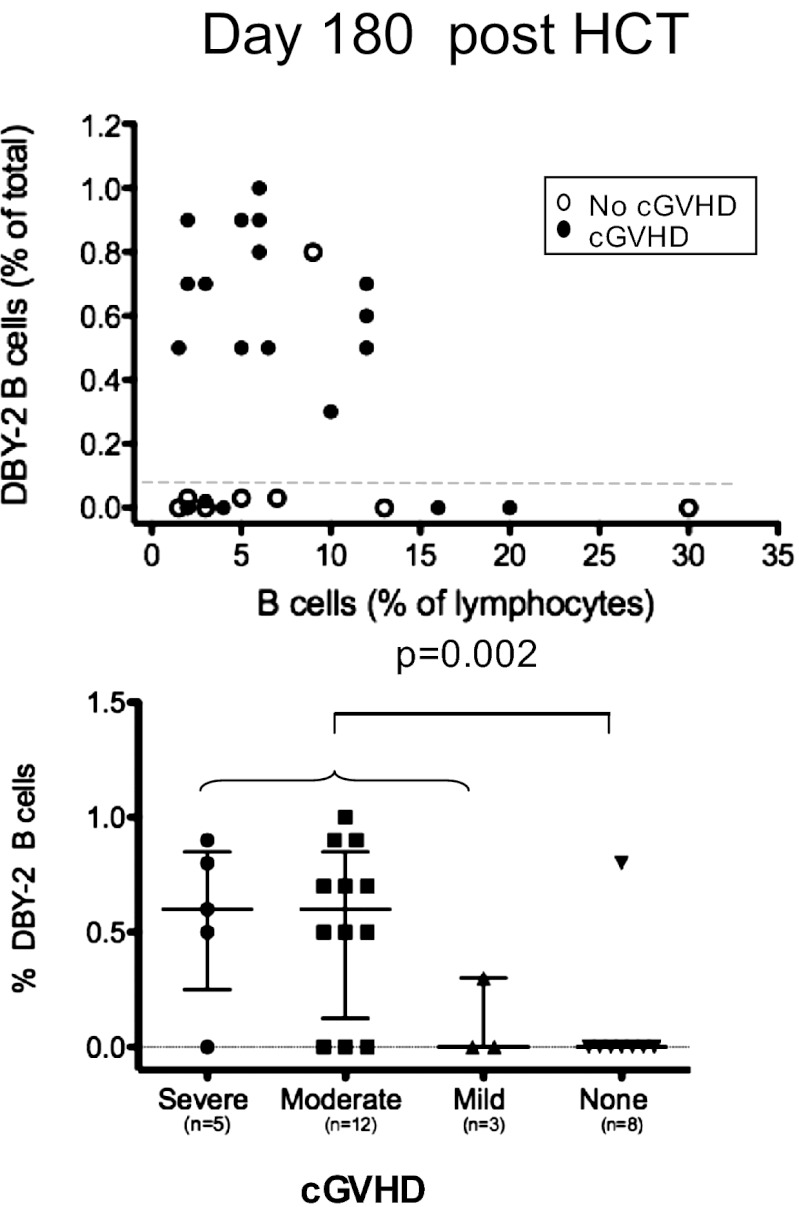
Fig. 4.
Anti–DBY-2 B-cell frequencies quantified 180 d after 28 F→M HCT. y-axis in both the Upper and Lower shows the relative frequency of DBY-2–binding B cells in relation to total PBMC lymphocytes shown on the x-axis (above) or in relation to cGVHD severity (below). (Upper) Open circles indicate cGVHD patients; closed circles show similar data for patients who did not develop cGVHD. (Lower) Anti–DBY-2 B-cell staining associates with any cGVHD development in comparison with none (P = 0.004; Fisher exact test).

