Figure 3.

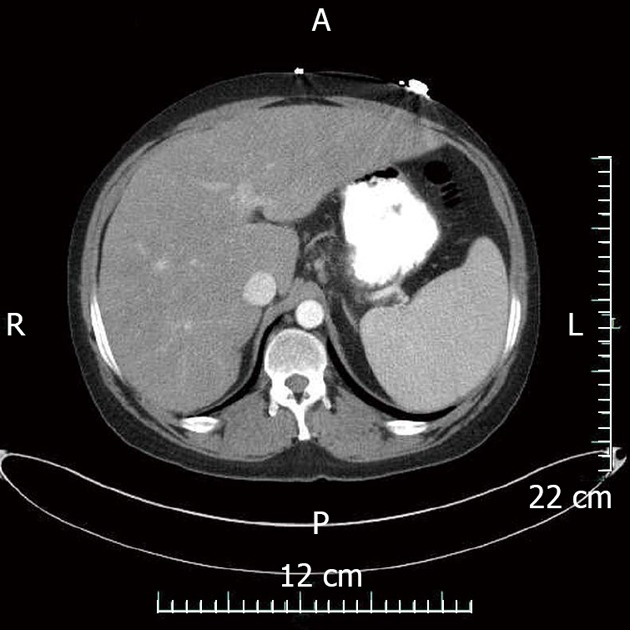
Computed tomography abdomen with contrast demonstrating marked reduction in spleen size and moderate reduction in hepatomegaly after 5 mo of steroid treatment. A: Anterior; P: Posterior; R: Right; L: Left.

Computed tomography abdomen with contrast demonstrating marked reduction in spleen size and moderate reduction in hepatomegaly after 5 mo of steroid treatment. A: Anterior; P: Posterior; R: Right; L: Left.