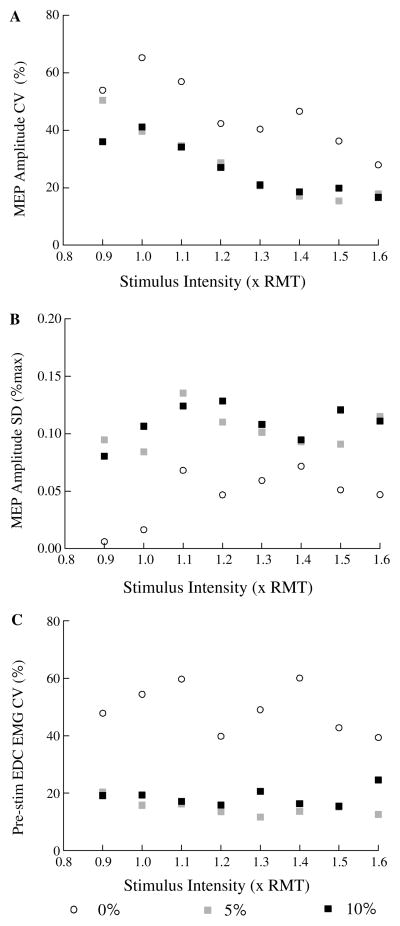
Fig 3.
a Mean coefficient of variation (CV) of peak-to-peak MEP amplitude versus stimulation intensity at different muscle contraction levels. b Mean absolute variability (SD) of peak-to-peak MEP amplitudes (% of max MEP) versus stimulus intensity at different activation levels. c Mean coefficient of variation of pre-stimulus EMG levels versus stimulus intensity at three different finger extensor contraction levels (0, 5 and 10% of maximum voluntary force). Each plotted point is the mean of within-subject coefficients of variation or standard deviations from eight subjects at a single stimulus intensity and activation level

