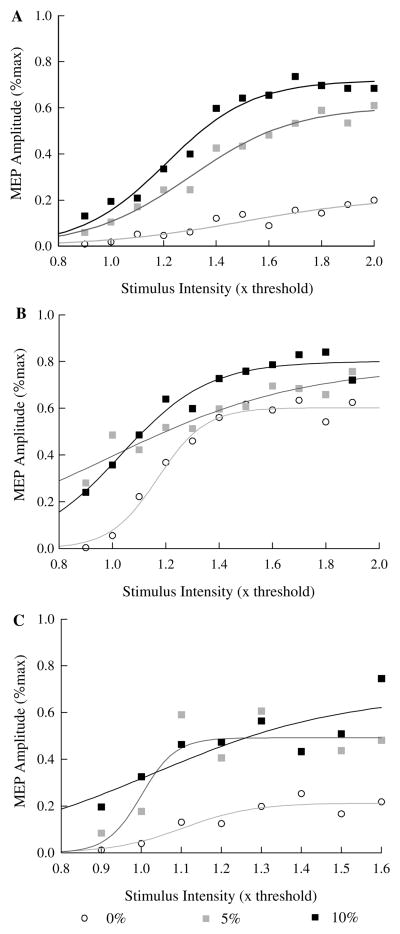
Fig 4.
Motor cortex recruitment curves (peak-to-peak MEP amplitude versus stimulus intensity) at different pre-stimulus activation levels for three subjects (a, b, c). Each plotted point is the mean MEP amplitude for five consecutive stimuli at one stimulus intensity and contraction level (0, 5, 10% of maximum voluntary finger extensor force) in a single subject. The three plotted lines are best-fit non-linear (Boltzmann equation) regression lines for 0, 5 and 10% contraction levels

