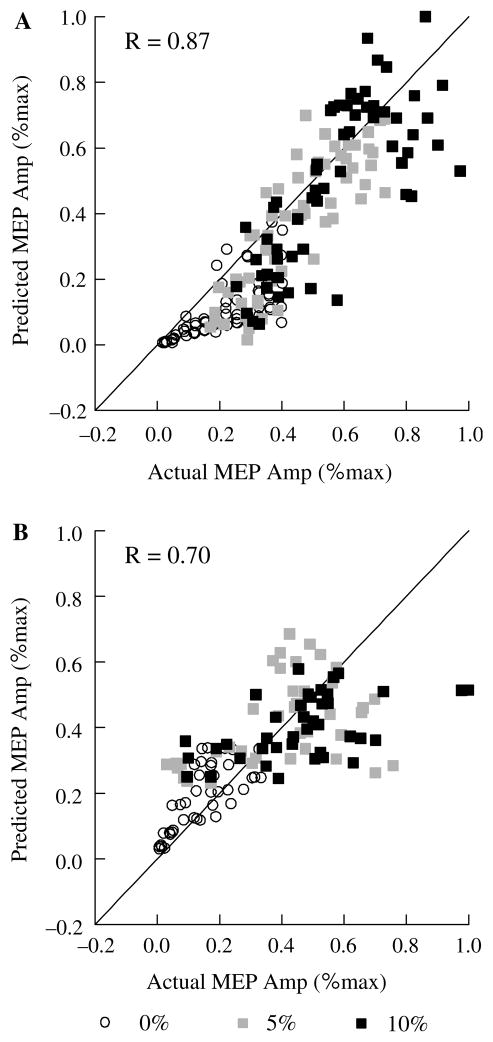
Fig 5.
Scattergraphs showing actual MEP amplitude versus MEP amplitude predicted from linear multiple regression with stimulus intensity and average pre-stimulus EMG amplitude as independent variables in two subjects. Each plotted point represents the peak-to-peak amplitude of a single MEP in one subject

