
Fig 1.
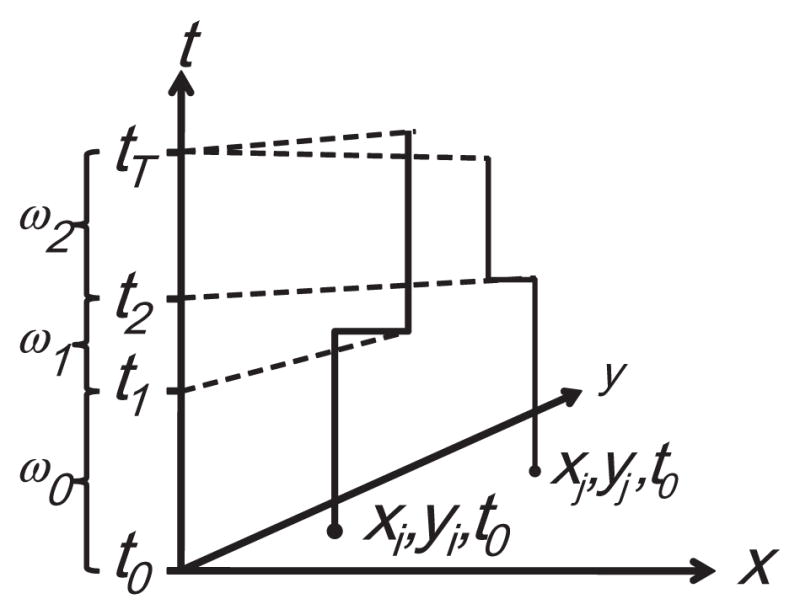
Residential histories as space–time step functions. The axes x and y define a geographic domain (e.g. longitude and latitude decimal degrees), the t axis represents time (e.g. date). The study extends from time t0 to time tT. The residential histories for persons i and j are shown as step functions through space–time. For example, person i begins the study residing at location xi, yi, t0. They remain at that geographic coordinate until the instant before time t1, when they move to xi, yi, t1. The duration of time they reside at this first place of residence is ω0.