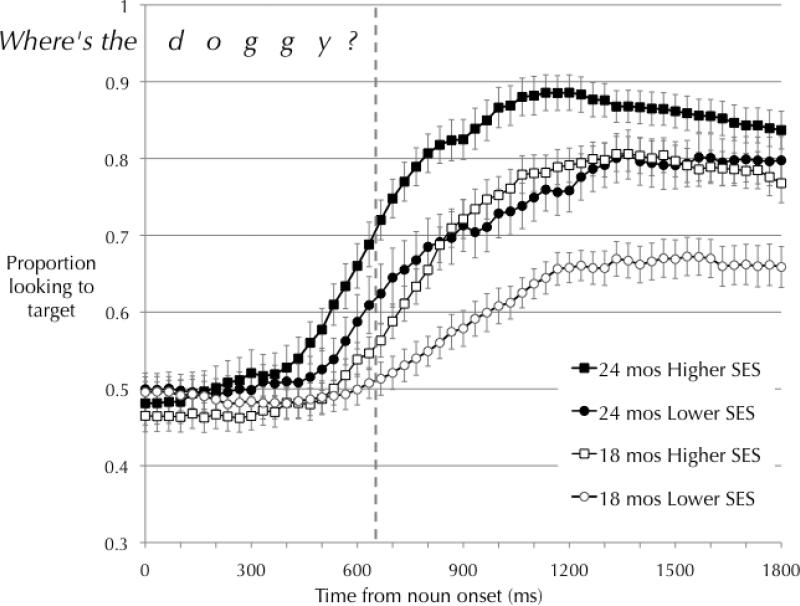
Figure 4.
Mean proportion of looking to the target as a function of time in ms from noun onset for Lower-SES and Higher-SES learners. Open squares/circles represent the time course of correct looking at 18 months; filled squares/circles represent the time course of looking in the same children at 24 months. Error bars represent SE of the mean over participants.

