
Figure 3.
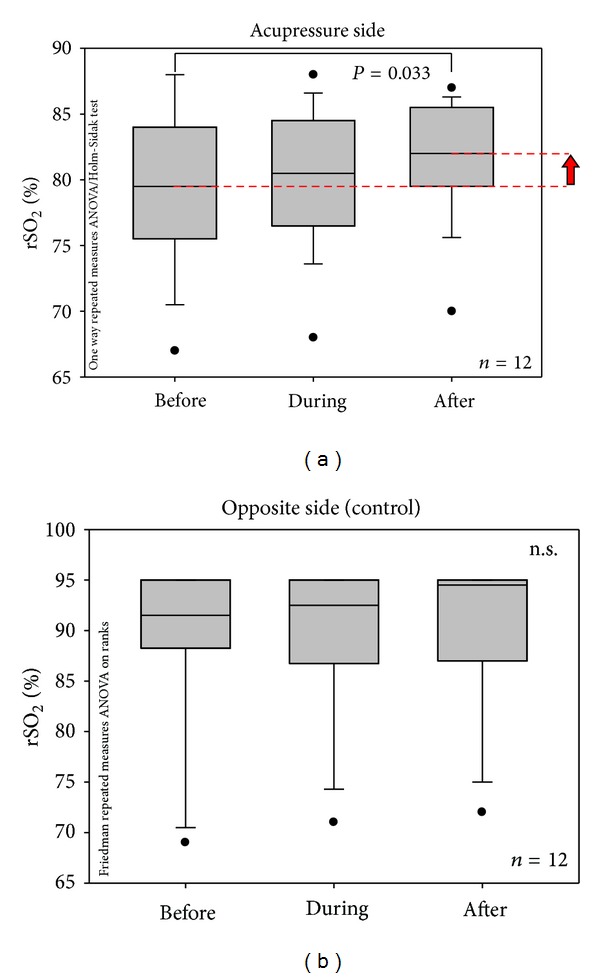
(a) Box plot presentation of changes of regional oxygen saturation values in 12 healthy volunteers before, during, and after acupressure (comp. Figure 2) on the stimulated side (acupressure side). Note the significant increase immediately after the 5-minute acupressure phase; the median of the rSO2 was increased by 2.5% compared to baseline values. The ends of the boxes define the 25th and 75th percentiles with a line at the median, and error bars defining the 10th and 90th percentiles. (b) Box plot presentation of changes of regional oxygen saturation values in 12 healthy volunteers before, during, and after acupressure (comp. Figure 2) on the opposite (control) side. For further explanations, see Figure 3(a).