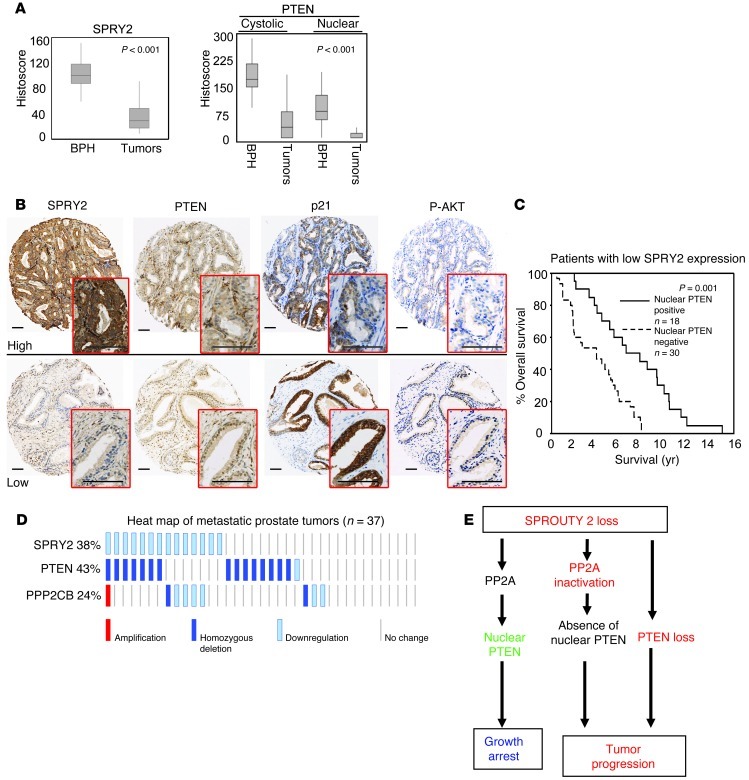
Figure 11. Impact of SPRY2, PTEN, and PP2A status in clinical PC.
(A) TMA of clinical PC and BPH cohorts was analyzed for expression of SPRY2 and nuclear and cytoplasmic PTEN. Box and whisker plots show median (lines within boxes), interquartile range (bounds of boxes), and upper and lower range (whiskers). Data were analyzed by ANOVA using Dunnett’s multiple comparison test. (B) Representative IHC images in clinical BPH samples. Scale bars: 100 μm. (C) Kaplan-Meier survival plot for PC patients with reduced SPRY2 expression (below median histoscore); analysis was according to the levels of nuclear PTEN. (D) Heat map of alterations in SPRY2, PTEN, and PPP2CB (PP2A catalytic subunit) generated from metastatic tumors (27 cases) using MSKCC Prostate Oncogenome Project data set from cBio genomic portal. (E) Schematic of PC progression. SPRY2 loss leads to tumor suppression by inducing growth arrest via PP2A-mediated nuclear accumulation of PTEN. Subsequent inactivation of PTEN or PP2A as observed in clinical PC may drive tumor progression.

