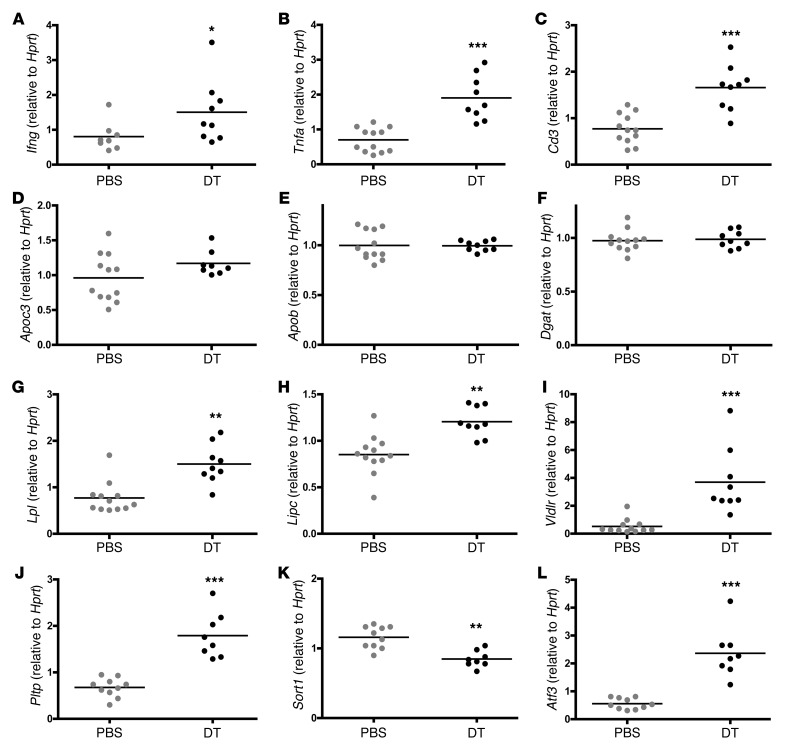
Figure 7. Treg depletion modulates expression of genes controlling inflammation and lipid metabolism in the liver.
Quantitative real-time RT-PCR analysis of liver mRNA from DEREG/Ldlr–/– mice treated for 8 weeks with DT or PBS. Signals were normalized to Hprt. *P < 0.05; n = 6 per group. (A) Ifng, (B) Tnfa, (C) Cd3, (D) Apoc3, (E) Apob, (F) Dgat, (G) Lpl, (H) Lipc, (I) Vldlr, (J) Pltp, (K) Sort1, and (L) Atf3.

