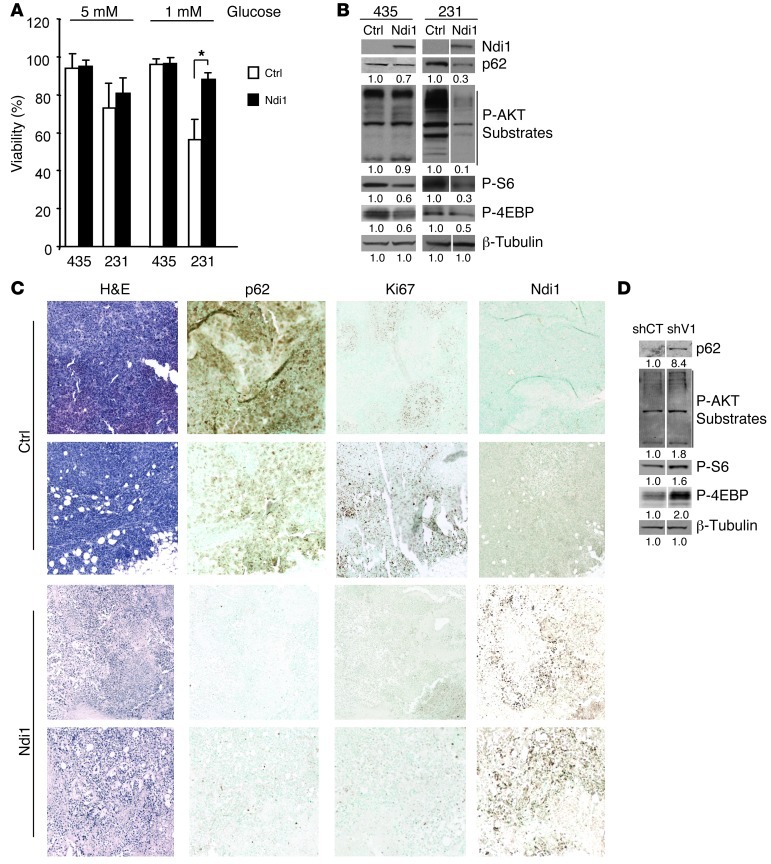
Figure 3. Mitochondrial complex I activity regulates mTORC1 and autophagy.
(A) Ndi1 expression enhanced resistance to glucose deprivation in MDA-MB-231 cells, shown after 72 hours of incubation in medium with 5 versus 1 mM glucose. Viability was measured by flow cytometry (non–sub-G0/G1 population). n = 3 independent analyses. *P < 0.05, unpaired 2-tailed Student’s t test. (B) Ndi1 expression influenced mTORC1 activity and autophagy. Western blot analysis for p62, phospho-AKT substrates, and the mTORC1 kinase–related substrates phospho-S6Ser240/244 and phospho-4EBPThr37/46 in MDA-MB-435 or MDA-MB-231 control and Ndi1-expressing cells. β-Tubulin was used as protein loading control. Signal quantification, measured by infrared imaging (total of detectable bands) and expressed relative to control, is shown below. Results are representative of 5 independent experiments. Lanes were run on the same gel but were noncontiguous (white lines). (C) H&E staining and p62, Ki67, or Ndi1 expression in mammary fat pad tumors 5 weeks after implanting 2.5 × 10⁵ MDA-MB-435 control versus Ndi1-expressing cells into SCID mice. 2 representative tumors of 6 are shown per group. Original magnification, ×10. (D) Inhibition of complex I activity through NDUFV1 knockdown affected mTORC1 activity and p62 elimination. Western blot analysis for p62, phospho-AKT substrates, phospho-S6Ser240/244, and phospho-4EBPThr37/46, comparing NDUFV1-knockdown versus control MDA-MB-435 cells. Signal quantification, measured by infrared imaging (total of detectable bands) and expressed relative to control, is shown below. Results are representative of 3 independent experiments. Lanes were run on the same gel but were noncontiguous (white lines).

