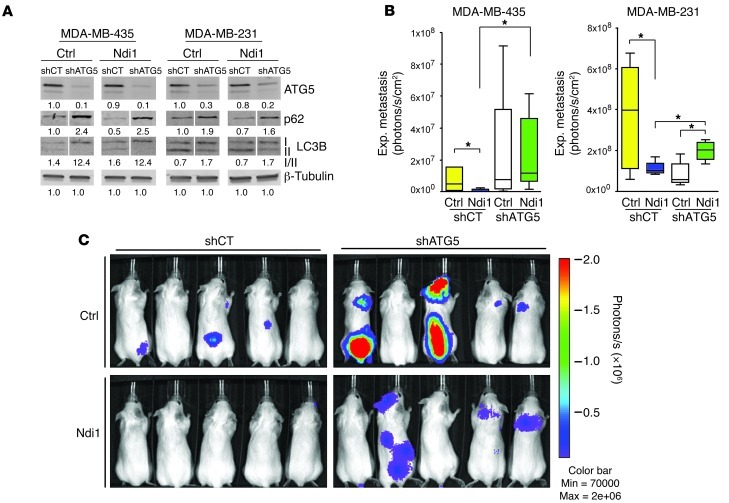
Figure 4. Metastasis inhibition by enhanced complex I activity depends on autophagy.
(A) ATG5 knockdown (shATG5) inhibited autophagy in MDA-MB-435 and MDA-MB-231 control and Ndi1-expressing cells, as shown by p62 and LC3BI accumulation. Signal quantification of ATG5, p62 signal, and LC3BI/II ratios, measured by infrared imaging (total of detectable bands) and expressed relative to control, is shown below. β-Tubulin served as protein loading control. Lanes were run on the same gel but were noncontiguous (white lines). (B) ATG5 knockdown blocked the antimetastatic effect of Ndi1 in MDA-MB-435 and MDA-MB-231 cells. Lung colonization was measured by ex vivo lung imaging 7 weeks after i.v. injection of 2.5 × 10⁵ tumor cells (n = 8 per group). Boxes denote interquartile range; lines within boxes denote median; whiskers denote minima and maxima. *P < 0.05, nonparametric Mann-Whitney test. (C) ATG5 knockdown enhanced multiorgan metastasis and reversed metastasis inhibition by Ndi1 in MDA-MB-435 cells. Shown is noninvasive bioluminescence imaging of 5 representative mice per group at 7 weeks after tail vein injection of 2.5 × 10⁵ MDA-MB-435 control or Ndi1-expressing cells, with or without ATG5 knockdown.

