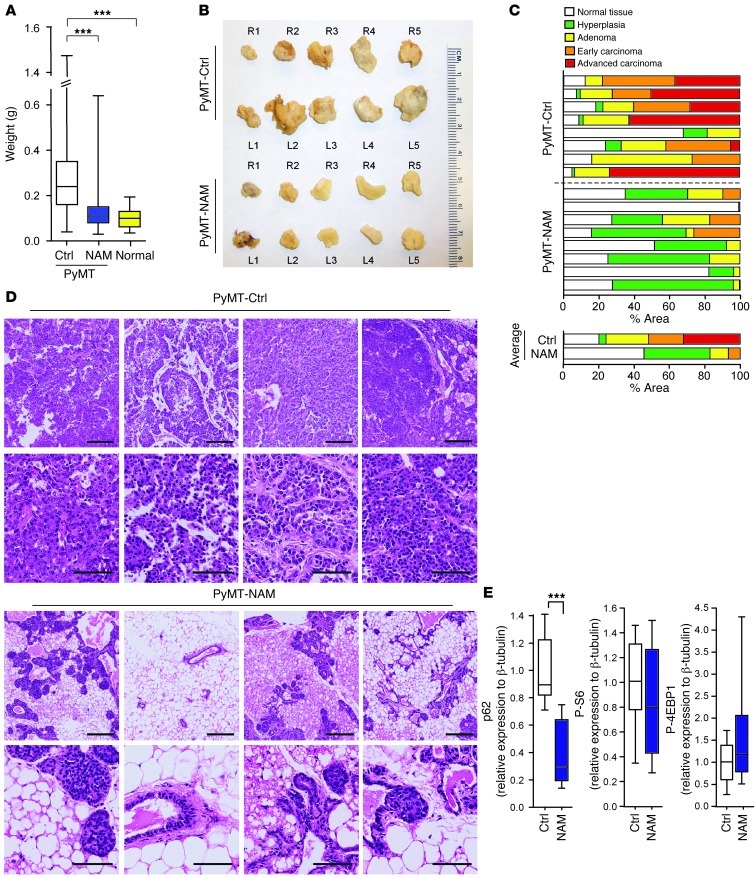
Figure 8. NAD+ precursor treatment inhibits spontaneous breast cancer progression in MMTV-PYMT mice.
(A) NAM treatment (1% in drinking water throughout experiment, beginning at weaning) reduced mammary tumor growth. Weights of all 10 mammary fat pads from each treated mouse (n = 10), untreated control mice (n = 11), and untreated age- and strain-matched PyMT-negative mice (Normal; n = 3). Boxes denote interquartile range; lines within boxes denote median; whiskers denote minima and maxima. ***P < 0.001, nonparametric Mann-Whitney test. (B) Fat pads of untreated versus NAM-treated PyMT mice, representative of the 10 fat pad locations. (C) NAM treatment inhibited PyMT-induced breast cancer progression. Percent area of morphological stages of 8 representative fat pads from untreated (PyMT-Ctrl) or NAM-treated (PyMT-NAM) mice. Averages from each group are shown below. Scoring of hyperplasia, adenoma, and early and advanced carcinoma was performed on whole-slide scans of H&E-stained tumor sections by morphometric measurements. (D) Representative microscopic fields of 2 H&E-stained sections from 4 tumors of untreated and NAM-treated PyMT mice. Scale bars: 200 μm (top row for each treatment group); 50 μm (bottom row). (E) Quantification of Western blot analyses of mammary tumors from control and NAM-treated PyMT mice (n = 8 tumors per group). Shown is relative protein abundance of p62, phospho-S6Ser240/244, and phospho-4EBPThr37/46. Boxes denote interquartile range; lines within boxes denote median; whiskers denote minima and maxima. ***P < 0.001, unpaired 2-tailed Student’s t test.

