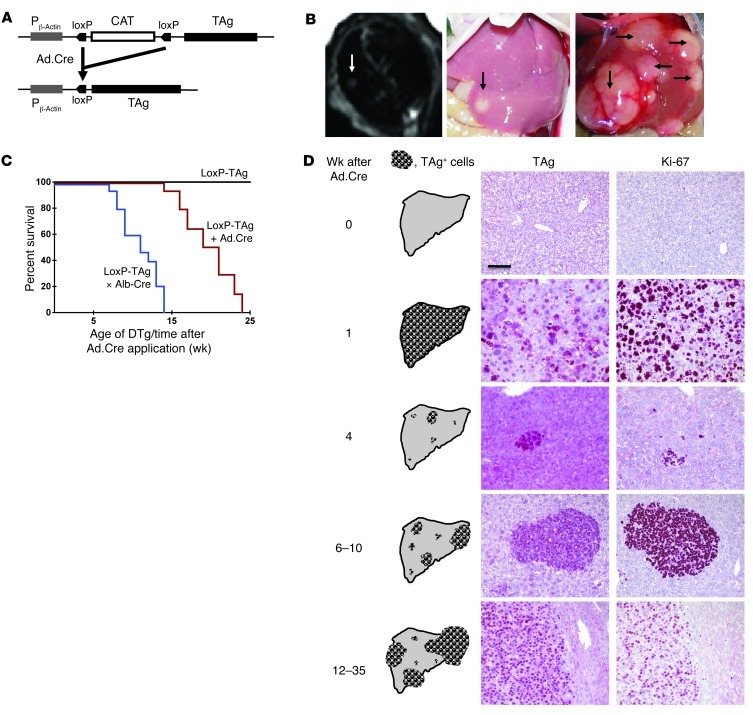
Figure 1. LoxP-TAg transgenic mice develop HCC after i.v. injection of Ad.Cre.
(A) Cre recombinase–mediated TAg activation. (B) For induction of HCC, 8- to 12-week-old LoxP-TAg mice were injected i.v. with 1 × 10⁹ PFUs of Ad.Cre, and HCC development was detected by MRI and palpation. Representative MR images (left) and macroscopically visible tumors of livers 10 (middle) and 20 weeks (right) after Ad.Cre injection are shown. MR image and liver photograph (middle) are from the same mouse. Arrows indicate tumor nodules. (C) LoxP-TAg mice that received Ad.Cre (red line, n = 14) and double-transgenic LoxP-TAg × Alb-Cre (DTg) mice (blue line, n = 15) were monitored for HCC development. Nontreated LoxP-TAg mice (black line; n = 10) served as control. Time after adenovirus injection is given for Ad.Cre-injected mice, and age is given for double-transgenic LoxP-TAg × Alb-Cre mice. (D) Immunohistology of liver tissue sections of LoxP-TAg mice at different time points after Ad.Cre injection as indicated. Tissues were stained with antibodies specific for TAg and Ki-67 and counterstained with hematoxylin. Scale bar: 100 μm. At least 3 mice were analyzed for each time point, and a representative staining is shown. Schematic drawings show an overview of the cumulative data of the average tumor number and progression not considering inter-mouse variability.

