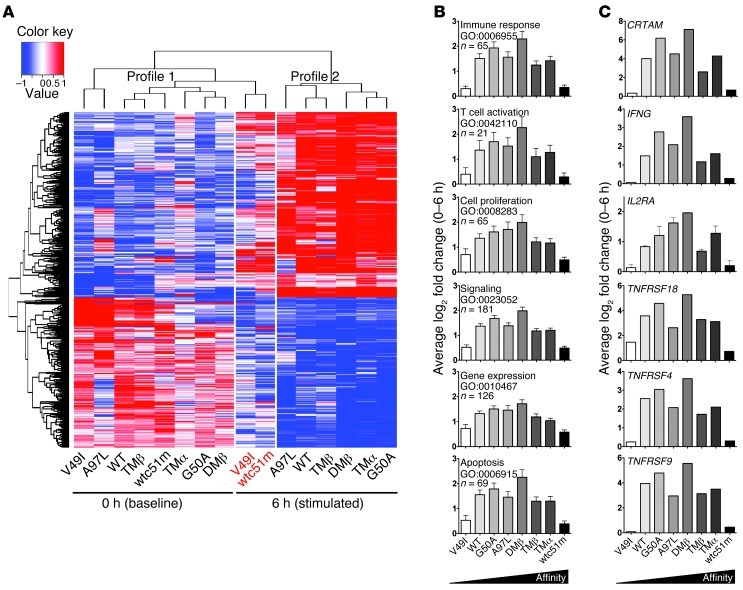
Figure 2. Gene expression of CD8+ T cells engineered with TCR of incremental affinities.
(A) Microarray hierarchical clustering of gene expression intensities from the 538 gene probes with statistically significant changes in expression values (> 2-fold and adjusted P < 0.05) after 6-hour stimulation with unlabeled A2/NY-ESO-1–specific multimer (0.002 μg/ml) separated the samples in 2 profiles shown above the heat map. Upregulated probes are shown in red, downregulated in blue. Expression profiles of genes from CD8+ T cells transduced with either very low (V49I) or very high (wtc51m) affinity TCRs, after 6-hour stimulation (names depicted in red) cluster together within the unstimulated (0 hour) profile 1 group. (B) 524 genes enriched between 0 and 6 hours in T cells transduced with TCRs giving maximal function (G50A, A97L, DMβ, TMβ) could be classified using GOTermFinder. (C) Log2-fold changes in the expression levels of representative TCR response genes (CRTAM, IL2RA), T cell effector cytokine (IFNG), and costimulatory molecules (TNFRSF18 [GITR], TNFRSF4 [OX40], TNFRSF9 [4-1BB]).

