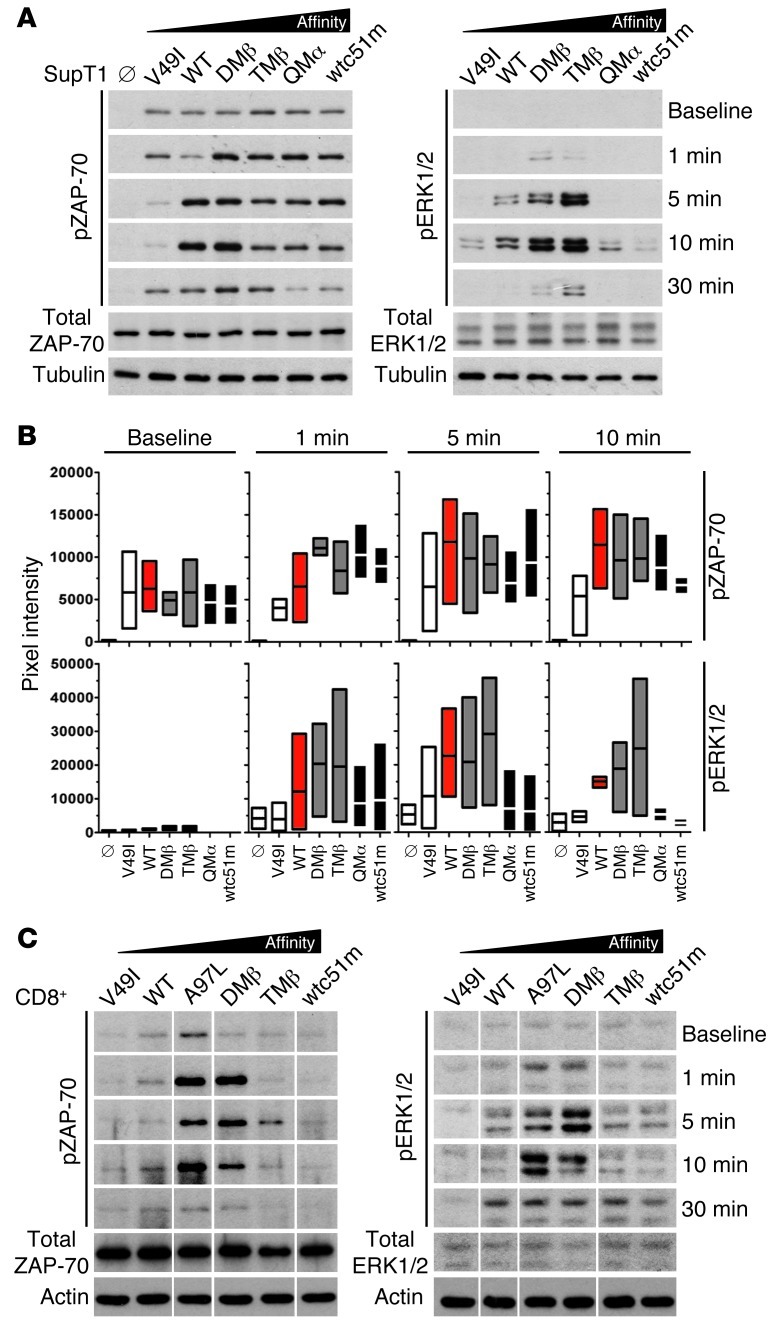
Figure 3. Levels of ZAP-70 and ERK 1/2 phosphorylation in SUP-T1 and CD8+ T cells engineered with TCRs of incremental affinities.
(A and C) TCR-transduced SUP-T1 T cells (A) and CD8+ T cells (C) were stimulated with 10 μg/ml A2/NY-ESO-1157–165 multimers at 37°C for the indicated time points. Total ZAP-70 and ERK 1/2 are shown as internal controls, while α-tubulin (A) or actin (C) expression levels were used as loading controls between samples. Data are each representative of 3 independent experiments. TCR-untransduced SUP-T1 cells are shown as empty controls (Ø). For CD8+ T cells, all lines were run on the same gel but were noncontiguous. (B) To allow direct comparison between the different SUP-T1–transduced TCR variants, intensity of ZAP-70 and ERK1/2 phosphorylation levels were quantified and normalized to α-tubulin. Data from 3 independent experiments are presented as min-to-max bar graphs with average mean lines.

