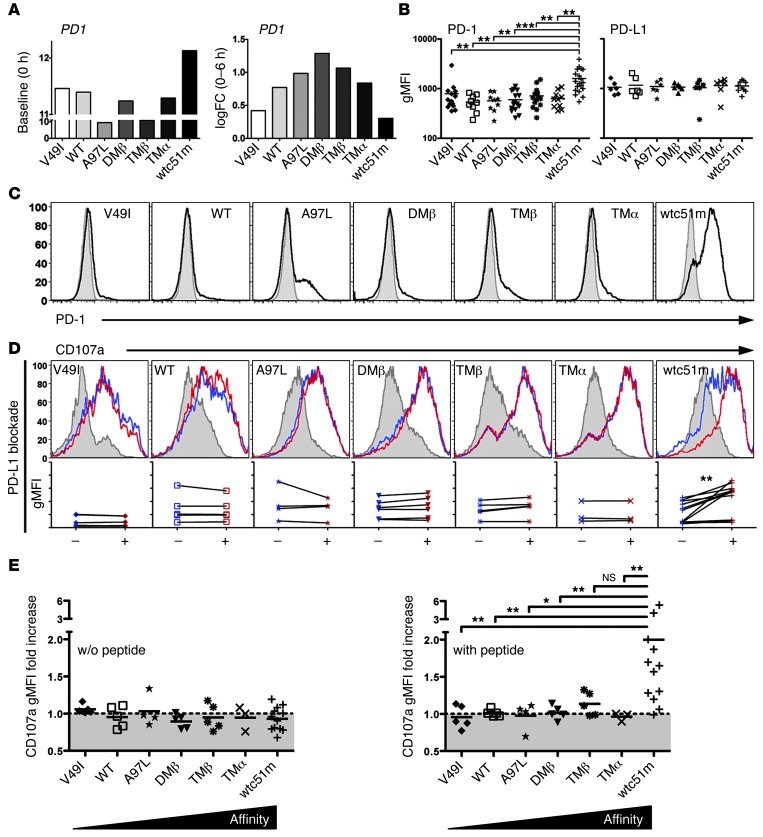
Figure 5. PD-1 expression in TCR-engineered CD8+ T cells and functional impact of PD-L1 blockade.
(A) Unstimulated at baseline (0 hour) and log2 fold change (0–6 hours) expression levels of PD1 transcripts as detected in microarray analysis. (B) Average surface expression of PD-1 (n > 9 independent experiments) and its ligand PD-L1 (n > 6 independent experiments) of TCR-engineered CD8+ T cells. Unpaired 2-tailed t test; ***P < 0.001; **P < 0.01. (C) Representative histograms of PD-1 surface expression (in MFI) in TCR-engineered CD8+ T cells under steady-state conditions. (D) Representative histograms of levels (in MFI) of the degranulation marker LAMP-1/CD107a in TCR-transduced CD8+ T cells without (control, blue histograms) or with PD-L1 blocking antibody (red histograms) prior to 4-hour stimulation with 10 μM NY-ESO-1157–165–loaded T2 cells. CD107a degranulation following stimulation with unloaded T2 cells is depicted as gray histograms. Graphs below each respective histogram represent the direct comparison of TCR stimulation–associated CD107a levels without (–) or with PD-L1 blockade (+). Data were obtained from more than 4 independent experiments. Paired 2-tailed t test, **P < 0.01. (E) Relative CD107a degranulation ratio (in gMFI) obtained in the presence versus the absence of PD-L1 blocking antibody. Graphs are depicted as relative CD107 fold increase following stimulation with unloaded (left panel) or NY-ESO-1–pulsed (right panel) T2 cells. Unpaired 2-tailed t test; **P < 0.01; *P < 0.05.

