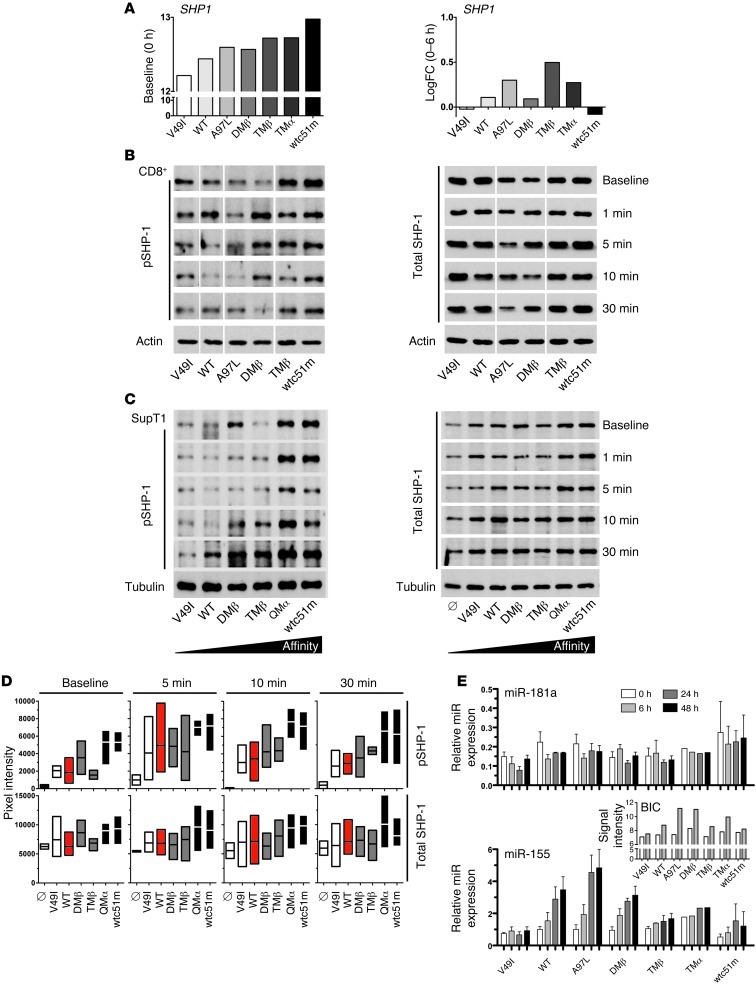
Figure 6. Levels of SHP-1 protein and of miR-155 and miR-181a expression in CD8+ T cells engineered with TCRs of incremental affinities.
(A) Unstimulated at baseline (0 hours) and log2 fold change (0–6 hour difference) expression levels of SHP1 transcripts as detected in microarray analysis. (B and C) TCR-transduced CD8+ T cells (B) and SUP-T1 cells (C) were stimulated with 10 μg/ml A2/NY-ESO-1157–165 multimers for the indicated time points and assessed for SHP-1 phosphorylation and total SHP-1 levels by Western blotting. Actin (B) or α-tubulin (C) expression levels were used as loading controls between samples. Data are each representative of 3 independent experiments. For CD8+ transduced T cell samples, all lines were run on the same gel, but were noncontiguous. TCR-untransduced SUP-T1 cells are shown as empty controls (Ø). (D) To allow direct comparison between the engineered SUP-T1 cells, intensity of SHP-1 phosphorylation and of total SHP-1 levels was quantified and normalized to α-tubulin (n = 3 independent experiments). (E) Expression levels of miR-181a and miR-155 were determined by qRT-PCR in TCR-transduced CD8+ T cells following stimulation with 0.1 μg/ml A2/NY-ESO-1157–165 multimers at the indicated time points. Data represent relative expression compared with RNU48 control and are representative of 3 independent experiments. Pri-miR-155 (BIC) mRNA expression values (inset) were retrieved from the microarray analysis.

