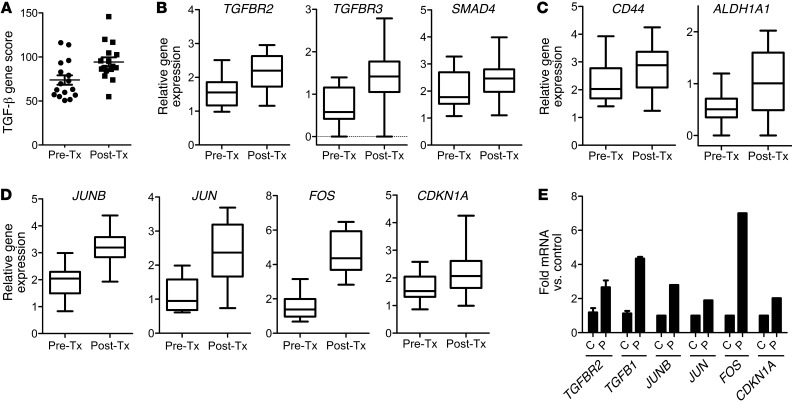
Figure 1. Chemotherapy-treated breast cancers display increased markers of TGF-β signaling and CSCs.
(A) NanoString analysis of TGF-β pathway genes in RNA extracted from breast cancer biopsies before chemotherapy (Pre-Tx) and after chemotherapy (Post-Tx). A TGF-β gene expression score was generated in both groups, as described in Methods (n = 17; paired Student’s t test, P = 0.002). (B) Box plots of TGFBR2, TGFBR3, and SMAD4 gene expression between biopsies before and after chemotherapy (TGFBR2: P = 0.007, TGFBR3: P = 0.0026, SMAD4: P = 0.012). Symbols indicate individual tumors; horizontal bars represent the mean. (C) Box plots of gene expression of CSC genes CD44 and ALDH1A1 (CD44: P = 0.013; ALDH1A1: P = 0.0067). (D) Box plots of FOS, JUNB, JUN, CDKN1A gene expression in the 17 paired tumors (paired Student’s t test, P < 0.0008 for all 4 comparisons). (B–D) In box-and-whisker plots, horizontal bars indicate the medians, boxes indicate 25th to 75th percentiles, and whiskers indicate 10th and 90th percentiles. (E) TGFB1 and TGFBR2 mRNA from SUM159 cells treated with or without 10 nM paclitaxel for 6 days was measured by quantitative RT-PCR (*P = 0.03). Using the TGF-β–specific PCR array described in Methods, the expression of JUNB, JUN, FOS, and CDKN1A were assessed and quantified in both control (C) and paclitaxel-treated (P) cells. Error bars indicate SEM.

