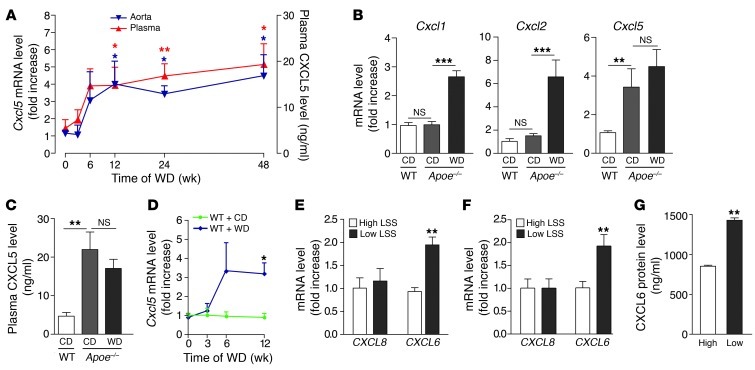
Figure 1. Upregulation of CXCL5 in atherosclerosis.
(A) Assessment of CXCL5 mRNA (blue triangles) and protein (red triangles) expression during the progression of atherosclerosis in aortas and plasma of Apoe–/– mice, respectively (n = 6–8 per time point), fed a WD for the indicated time. Apoe–/– mice fed a CD were used as controls. (B) Aortic Cxcl1, Cxcl2, and Cxcl5 mRNA and (C) plasma CXCL5 protein expression was measured in Apoe–/– mice fed CD or WD for 12 weeks (n = 8 mice per group). WT mice fed CD for 12 weeks were used as controls. (D) Assessment of Cxcl5 mRNA in aortas of WT mice (n = 6–8 per time point) fed WD. WT mice fed CD were used as controls. (E–G) HUVECs were subjected to high or low LSS and stimulated with (E) oxidized LDL (n = 3) or (F and G) IL-1β (n = 6). (E and F) CXCL8 and CXCL6 mRNA expression and (G) protein release were determined. (A–G) mRNA and protein levels were measured by qPCR and ELISA, respectively. Data are mean ± SEM. *P < 0.05, **P < 0.01, ***P < 0.001.

