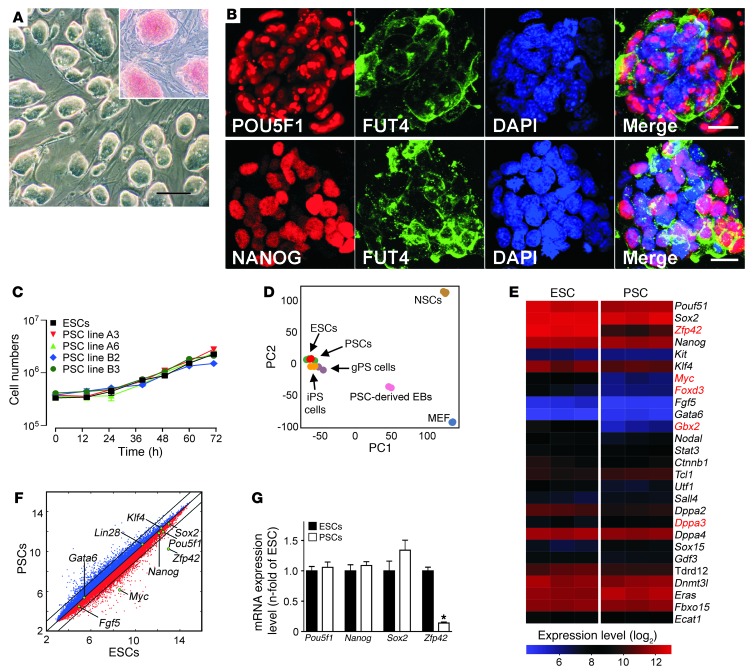
Figure 1. Basic characterization of PSCs.
(A) Undifferentiated PSCs cultured on MEFs formed ESC-like colonies with alkaline phosphatase activity (red – inset). Scale bar: 100 μm. (B) Immunofluorescence labeling of POU5F1, NANOG, and FUT4 (also known as SSEA1) in undifferentiated PSC colonies. Scale bars: 20 μm. (C) Growth kinetics of ESC line R1 and PSC lines A3, A6, B2, and B3 (n = 3 per group and time point; data represent means ± SEM; cell-doubling time: 16–17 hours). (D) PCA of global gene expression profiles of pluripotent cells (PSCs, ESCs, iPSCs, and gPSCs) and somatic cells (MEFs and neural stem cells [NSCs]). The respective Gene Expression Omnibus accession numbers are: GSE11274 (includes MEF and gPSCs); GSE10806 (includes NSC and iPSCs); and GSE30868 (includes ESCs [R1], PSCs [A3] and PSC-derived EBs [A3 EB culture day 15]). Each microarray experiment is represented by a dot, which is positioned in 2D space according to its similarity or degree of variance to all samples analyzed. PC1 and PC2 show variances of 47% and 20%, respectively. (E) Heat map of 80 annotated imprinted genes expressed in ESCs (R1 passage 25; n = 3) and PSCs (A3 passage 25; n = 3). Each gene is represented by a single row of colored boxes. Red represents transcript levels above median; blue represents transcript levels below median. (F) Comparison of global gene expression in ESCs and PSCs with key reprogramming factors highlighted. (G) qPCR of selected stemness factors (n = 4 per group; data represent means ± SEM).

