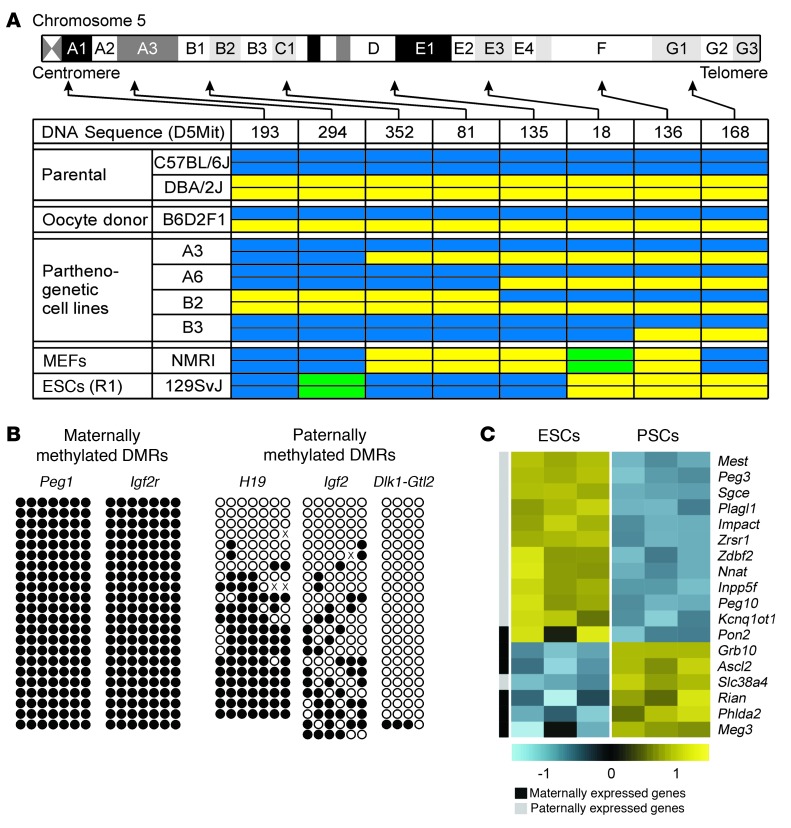
Figure 2. Characteristic genetic and epigenetic differences in ESCs and PSCs.
(A) Overview of chromosome 5 genotype demonstrating the expected variable allelic disparity in PSC lines (A3, A6, B2, B3). Color codes: C57BL/6J allele, blue; DBA/2J allele, yellow; alternative allele, green. (B) Bisulfite genomic sequencing of DMRs of imprinted genes in PSC line A3. Each row represents a cloned allele and each circle a CpG site (black circles represent methylated and white circles represent unmethylated CpG sites). (C) Differentially expressed imprinted genes in ESCs (R1; n = 3) versus PSCs (A3; n = 3). Each gene is represented by a single row of colored boxes. Color codes: yellow represents transcript levels above median; blue represents transcript levels below median.

