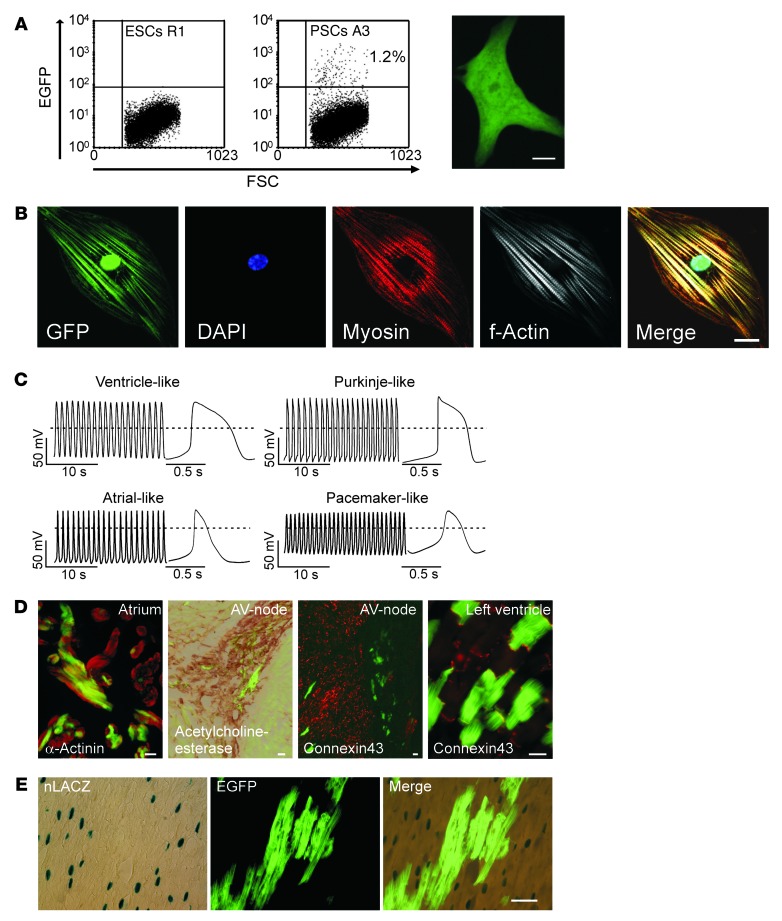
Figure 6. Cardiomyocyte differentiation from PSCs in vitro and in vivo.
(A) FACS of GFP-positive PCMs (culture day 7 + 15); nontransgenic ESCs served as the control cell population (right panel illustrates a PCM 24 hours after plating; also refer to Supplemental Video 1). (B) Morphology of FACS-purified PCMs (EGP-positive) assessed by confocal laser scanning microscopy. (C) Distinct APs in FACS-purified PCMs. (D) Epifluorescence images and histochemical staining of atrial, atrioventricular (AV) nodal (acetylcholinesterase-positive/connexin43-negative), and ventricular regions in chimeric adult mouse heart (generated by blastocyst injection of αMHC-EGFP PSCs, A3 line). (E) Heart section from a chimeric mouse after injection of αMHC-EGFP PSCs (A3 line) into αMHC-nLacZ blastocysts. Light microscopy after X-gal staining (left panel); epifluorescence image of the same section showing PSC-derived EGFP-positive cardiomyocytes (middle panel); merged image did not show cells double-positive for EGFP and nLacZ, ruling out overt fusion events (right panel). Scale bars: (A) 10 μm, (B and D) 20 μm, (E) 50 μm.

