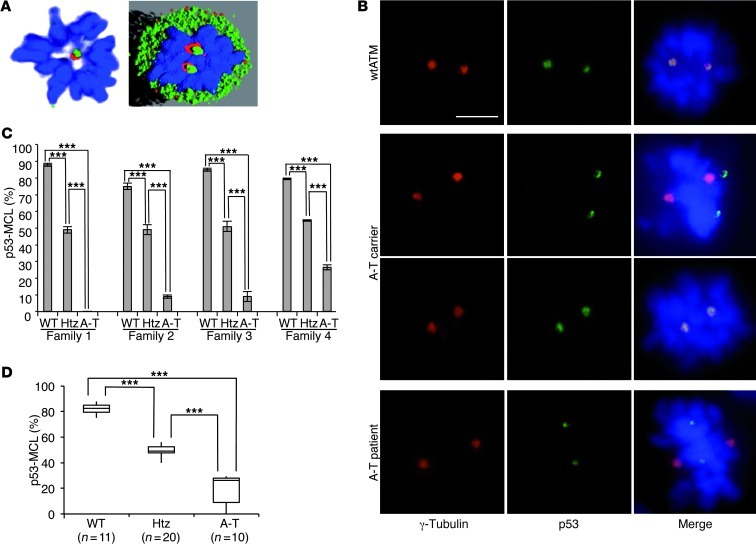
Figure 1. p53 centrosomal localization in mitotic LCLs.
(A) p53 centrosomal localization detected by confocal IF microscopy with anti-p53 (green) and anti–γ-tubulin (red) Abs. DNA was stained with DAPI (blue); representative image and its software analysis are shown in A. (B) Representative IF images of the indicated proteins in mitotic LCLs derived from the indicated donors. p53, centrosomes, and DNA are marked as in A. Scale bar = 5 μm. (C) Summary data of percentages of p53-MCL measured by 2 different operators who counted 100 metaphases per sample in quadruplicate. Data are expressed as mean ± SD. Four different families, each including 1 A-T patient (A-T), 1 parent (Htz), and 1 wtATM-carrying relative (WT) were evaluated. (D) Comparison of p53-MCL percentages, evaluated as in C, between LCLs derived from wtATM donors (n = 11), A-T carriers (n = 20), and A-T patients (n = 10). The 3 groups are significantly different. Box-and-whisker plot: horizontal lines within the box represent median values, and the bottom and top of the box show the lower and upper quartiles. ***P < 0.0001; 2-tailed Student’s t test.

