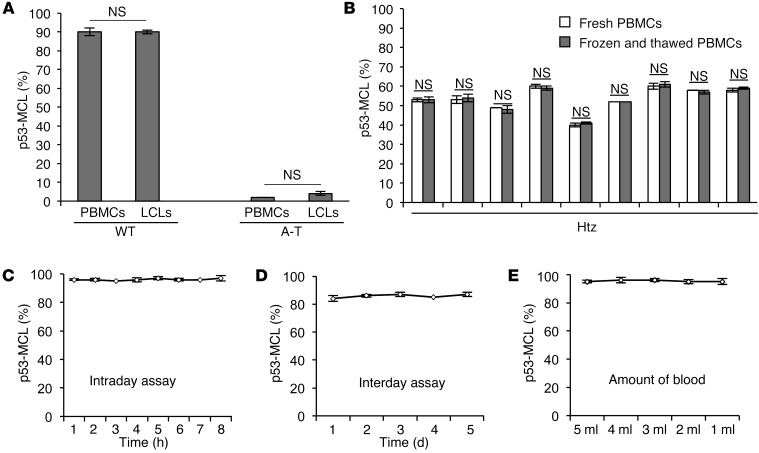
Figure 3. Assessment of p53-MCL test precision.
(A) Summary data of p53-MCL percentages in PBMCs and LCLs derived from 1 A-T patient and 1 healthy donor. No significant difference was observed between the 2 groups. Two-tailed Student’s t test. (B) Summary data of p53-MCL percentages in fresh PBMCs and frozen and thawed PBMCs. No significant difference was observed after freezing and thawing PBMCs from 9 different A-T carriers. (C) Intraday assay variability testing was performed on a single blood sample from 1 healthy donor as follows: PBMCs were PHA-stimulated for 60 hours and used to make 8 different coverslip preparations, each of which was immunostained at the indicated times after fixation. No significant difference was observed between the preparations. (D) Interday assay variability was performed by collecting and assessing PBMCs from the same healthy donor on 5 different days. No significant difference was observed among the samples. (E) To verify the minimal amount of blood required to perform the test, we collected 15 ml of blood from a single healthy donor and made 5 aliquots with different amounts of blood (from 1 to 5 ml). The test performed on PBMCs purified from the 5 different samples showed no significant differences, demonstrating that the assay can be performed with as little as 1 ml of whole blood. A 2-tailed Student’s t test was performed. All samples were analyzed by examining 100 metaphases per sample in quadruplicate. Data are expressed as mean ± SD. NS, not significant.

