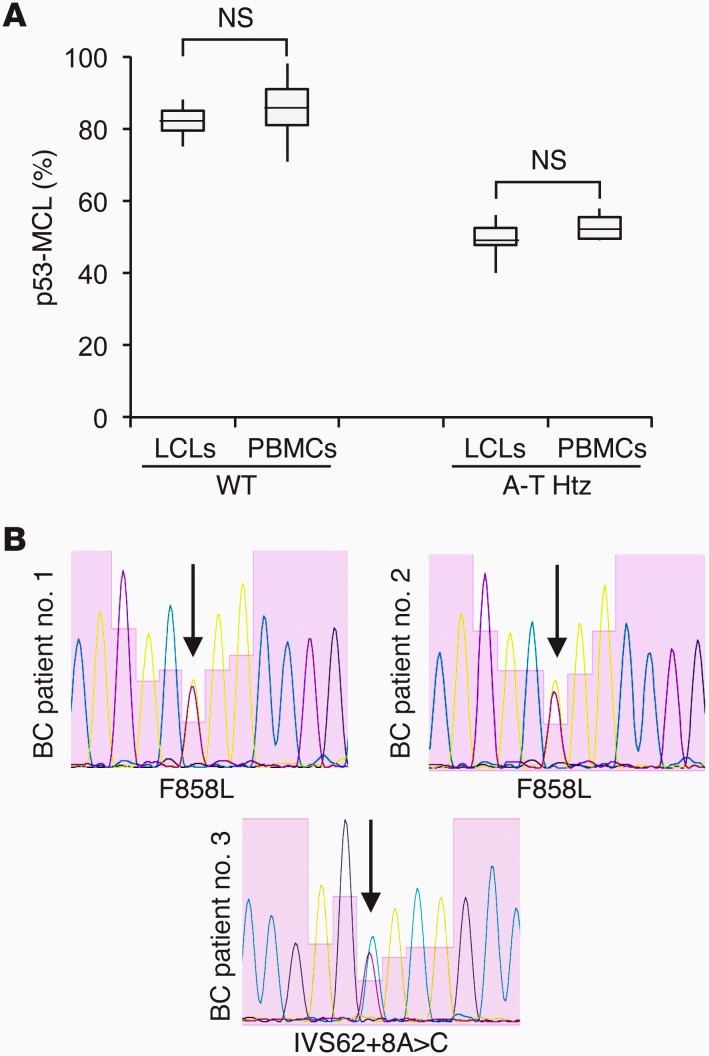
Figure 4. ATM in BC patients.
(A) Comparison of p53-MCL percentages between LCLs derived from wtATM donors (n = 11 from Figure 1D); PBMCs derived from healthy donors (n = 100); LCLs from obligate A-T carriers (n = 20 from Figure 1D); and PBMCs derived from BC patients scored as A-T carriers based on the p53-MCL test (n = 7). Box-and-whisker plot: horizontal lines within the box represent median values, and the bottom and top of the box show the lower and upper quartiles. Two-tailed Student’s t test. (B) Electropherograms of ATM exon 19 (BC patient no. 1 and BC patient no. 2), and intron 62 (BC patient no. 3) from BC patients scored as A-T carriers based on the p53-MCL test.

