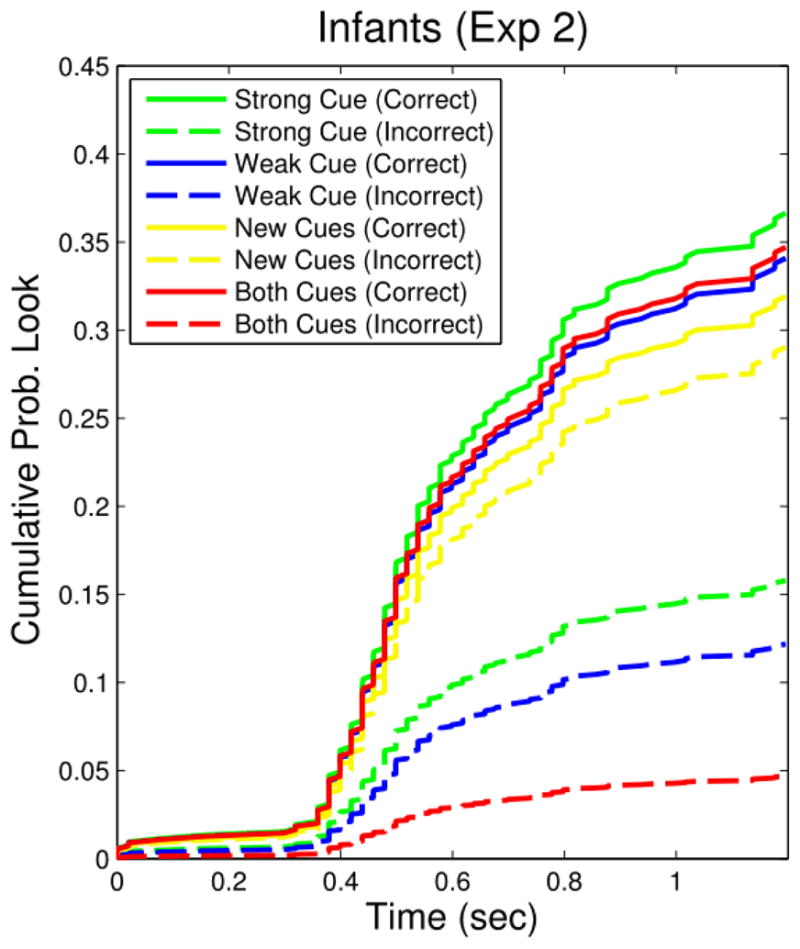
Figure 3.

Cumulative hazard functions for each cue/location combination for infants in Experiment 2. Each curve shows the estimated cumulative probability of a predictive look to a location (Correct/Incorrect) in the presence of a particular cue ( Strong/Weak/New/Both) over time. Infants predicted the appearance of a reinforcer to in the Correct location equally under all cue conditions. However, relative to the Strong and Weak Cues they predicted the reinforcer on the Incorrect side less in the presence of Both Cues and more in the presence of the New Cues.
