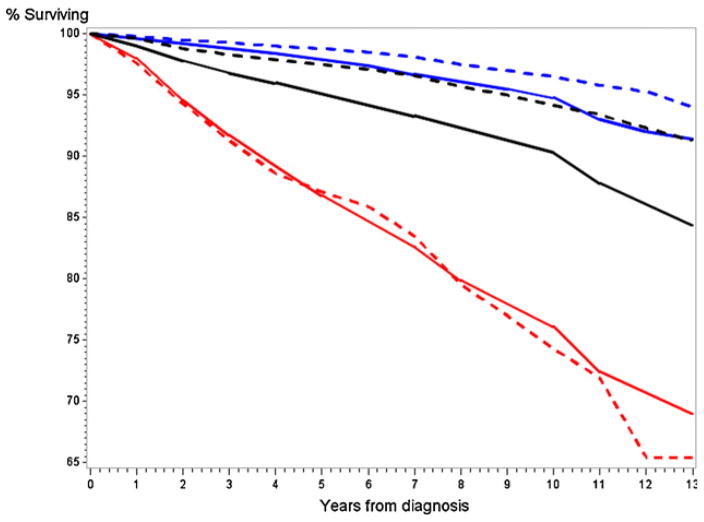
Fig 2.
Observed (in PLCO) versus expected (based on SEER) prostate cancer specific survival rates. Solid lines are expected rates, dashed lines observed rates. Black curves show all cases, red curves Gleason 8–10 cases and blue curves Gleason 5–7 cases. (For interpretation of the references to color in this figure legend, the reader is referred to the web version of the article.)

