Figure 2.
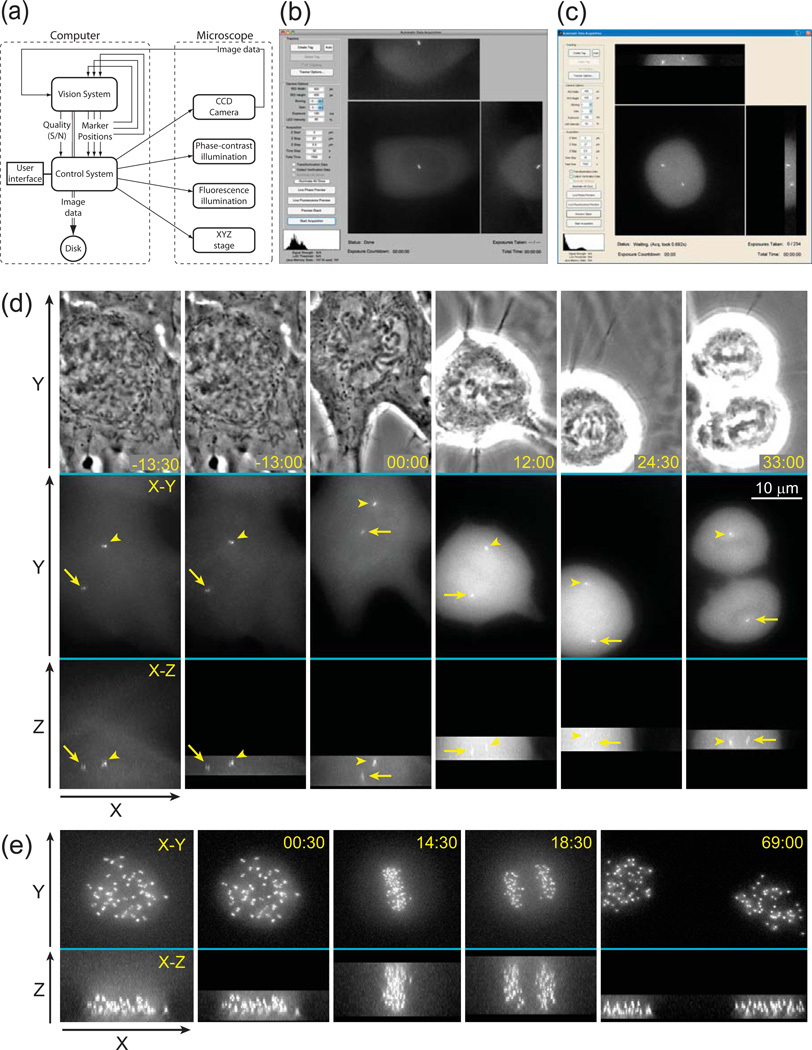
Principle layout and implementation of the Predictive-Focus Illumination (PFI) system. (a) Bloc-diagram of the PFI algorithm. (b) Computer screenshot of the PFI system after the initial preview. A data of 55 Z-planes has been collected and the user is prompted to manually mark OOIs or to execute their automatic detection. In this example the system runs under Mac OS X. (c) Computer screenshot of the PFI system during the acquisition loop. Only the focal planes adjacent to the positions of OOIs were illuminated. In this example the system runs under MS Windows 7. (d) Example of PFI recording. The cell line, light intensity, and acquisition parameters are the same as in Fig.1b; however, in this case only the focal planes adjacent to the positions of centrosomes are recorded in the PFI mode. (e) Example of PFI recording with a large number of OOIs. In this example 46 pairs of kinetochores were followed in a human RPE-1 cell. Notice that during anaphase kinetochores are spread throughout the entire Z-range (frame 18:30). However, during earlier and later stages of mitosis a significant number of exposures is avoided. Also notice that cells successfully progresses through mitosis with minimal photobleaching. Time in minutes : seconds. Time 00:00 corresponds to nuclear envelope breakdown.

