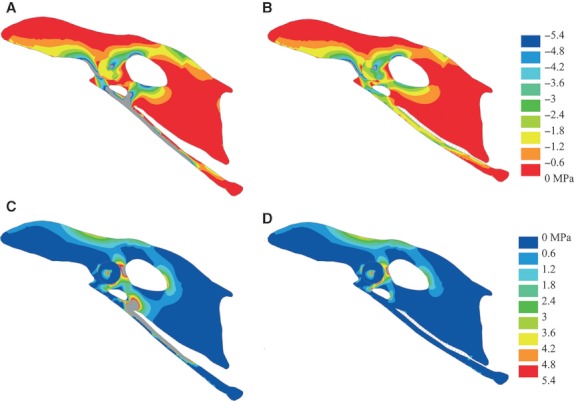
Fig. 2.

Principal stress plots and deformation of the pelvis of Gallus gallus. (A) Compressive principal stress plot without membrane; (B) compressive principal stress plot with membrane; (C) tensile principal stress plot without membrana ischiopubica, (D) tensile principal stress plot without membrana ischiopubica. Deformations are scaled by a factor of 1. Grey areas are in excess of 5.4 MPa.
