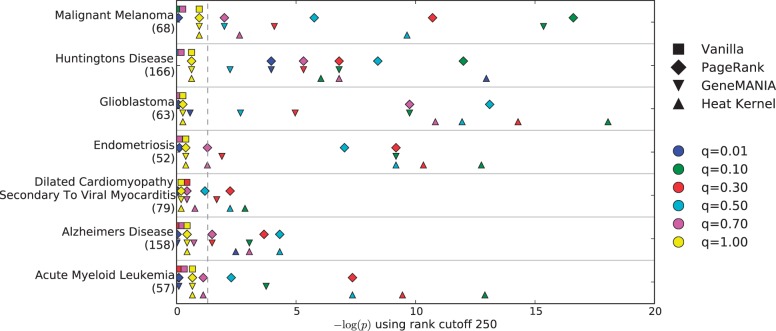
Fig. 1.
Negative logarithms of the hypergeometric P-values indicating the significance of the overlap between the members of seven KEGG pathways and the top 250 genes ranked by each algorithm for the corresponding disease. The number of genes in each KEGG pathway is provided in parentheses. Points to the right of the dashed gray line indicate significant P-values (P < 0.05)

