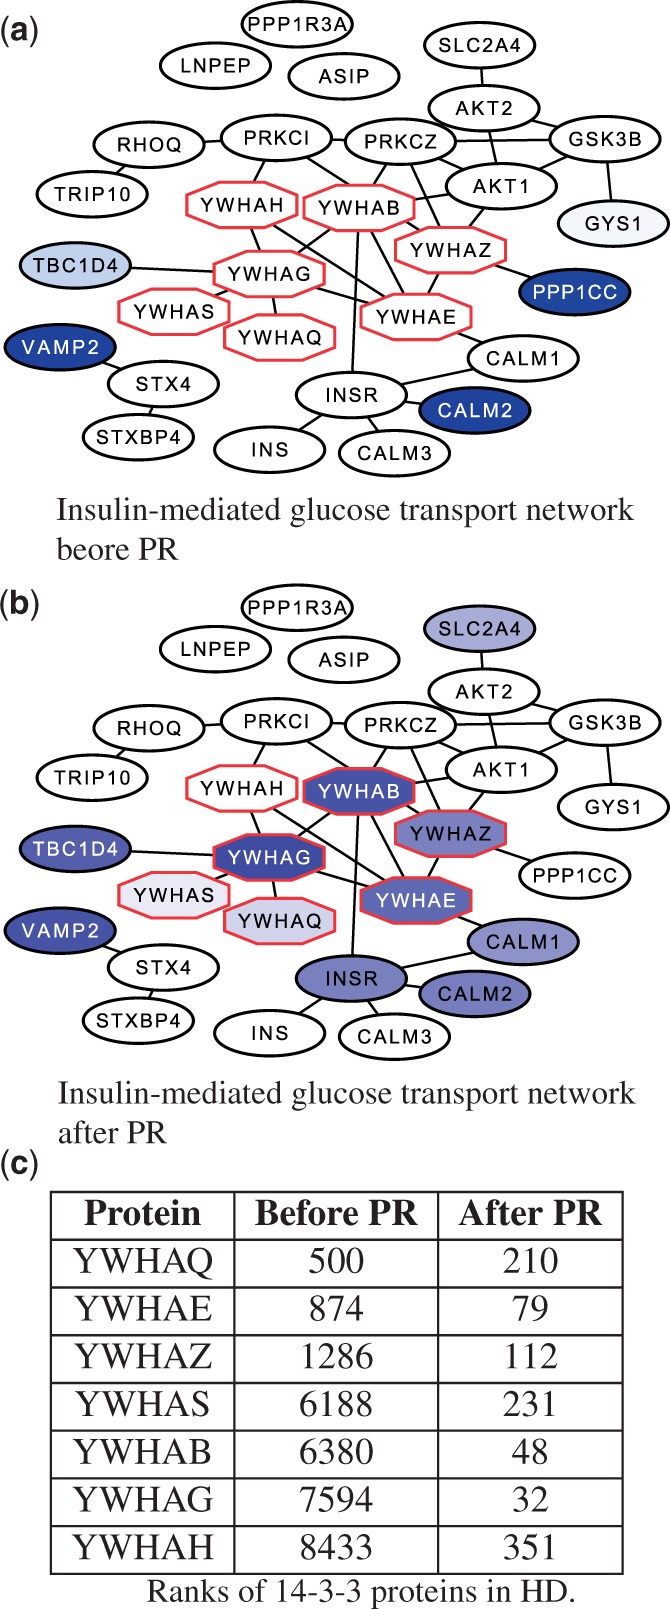
Fig. 4.

A comparison of the subnetwork induced by genes involved in the NCI PID pathway insulin-mediated glucose transport with nodes ranked by (a) differential expression P-values from patients diagnosed with HD and (b) after applying PR. Non-white nodes indicate genes ranked in the top 250, and darker nodes indicate higher ranking. Octagonal nodes indicate genes in the 14-3-3 family of proteins. Subnetwork visualizations for HK, GM and V are available in the Supplementary Text (Supplementary Fig. S6). (c) Ranks of 14-3-3 family proteins before and after applying PR to the HD expression data
