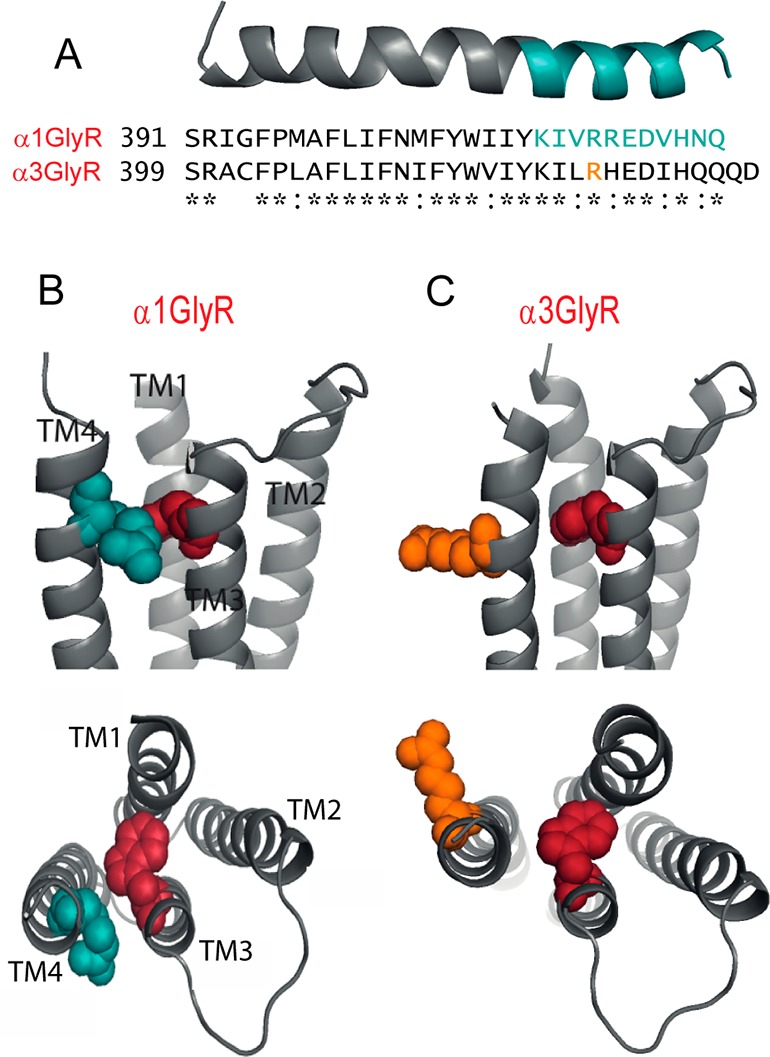
Figure 1.

Comparison of TM4 domains in α1 and α3 GlyRs. (A) Sequence alignment of TM4 domains and C-terminal tails, together with a homology model of the α1 TM4 domain. Residues investigated in this study are colored blue in the model and in the primary sequence. (B) Structural model of the outer TM region of the α1 GlyR, viewed from within the membrane, with the W286 and R414 side chains colored red and blue, respectively. Lower panel shows a view from the synapse with extracellular domain removed. (C) Corresponding views of the α3 GlyR structure, with the W286 and R422 side chains colored red and orange, respectively. The position of R422 in the α3 primary sequence is shown in orange in (A).
