
Figure 4.
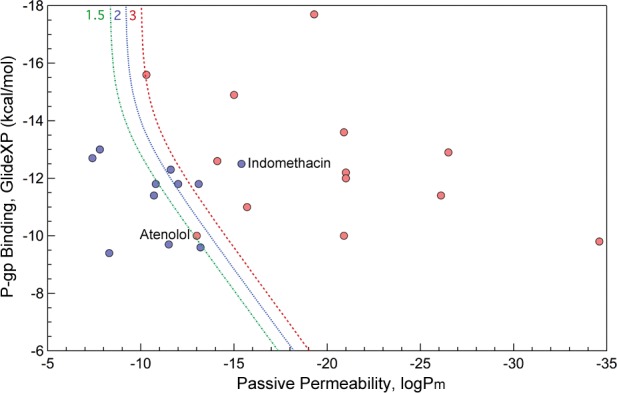
Calculated passive permeability and P-gp efflux for CNS+ (red) and CNS– (blue) compounds as classified based on experimental measurements in the study of Wang et al.7 The lines correspond to computed efflux ratio values of 1.5 (green), 2 (blue), and 3 (red).