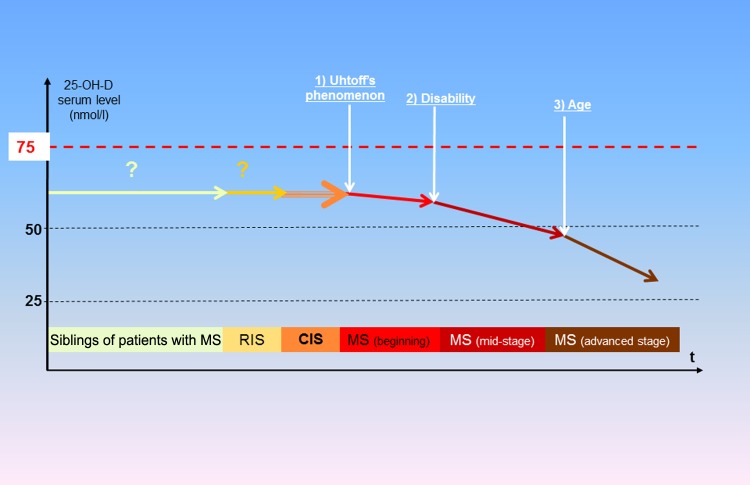
Figure 3.
Schematic representation of the evolution of 25-OH-D serum level according to multiple sclerosis stage.
Note that there are so far no data in patients with RIS and siblings of patients with MS but it may be inferred that their 25-OH-D serum concentrations are not very different from those of ‘normal’ populations. CIS, clinically isolated syndrome; MS, multiple sclerosis; RIS, radiologically isolated syndrome.

