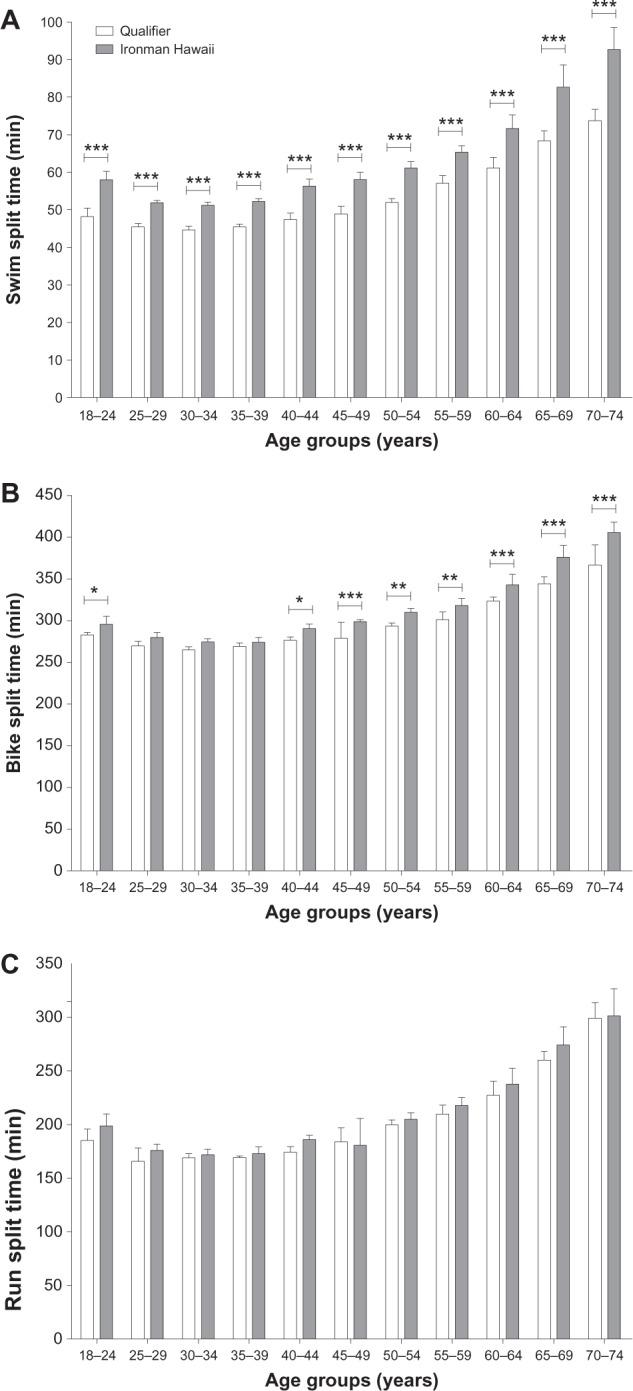
Figure 7.

Performance for the top ten men per age group in the swim split (A), the bike split (B), and the run split (C) in the Ironman qualifier races and in Ironman Hawaii.
Notes: Asterisks above bars indicate significant differences in performance between the Ironman qualifier races and Ironman Hawaii: *P<0.05; **P<0.01; ***P<0.001.
